

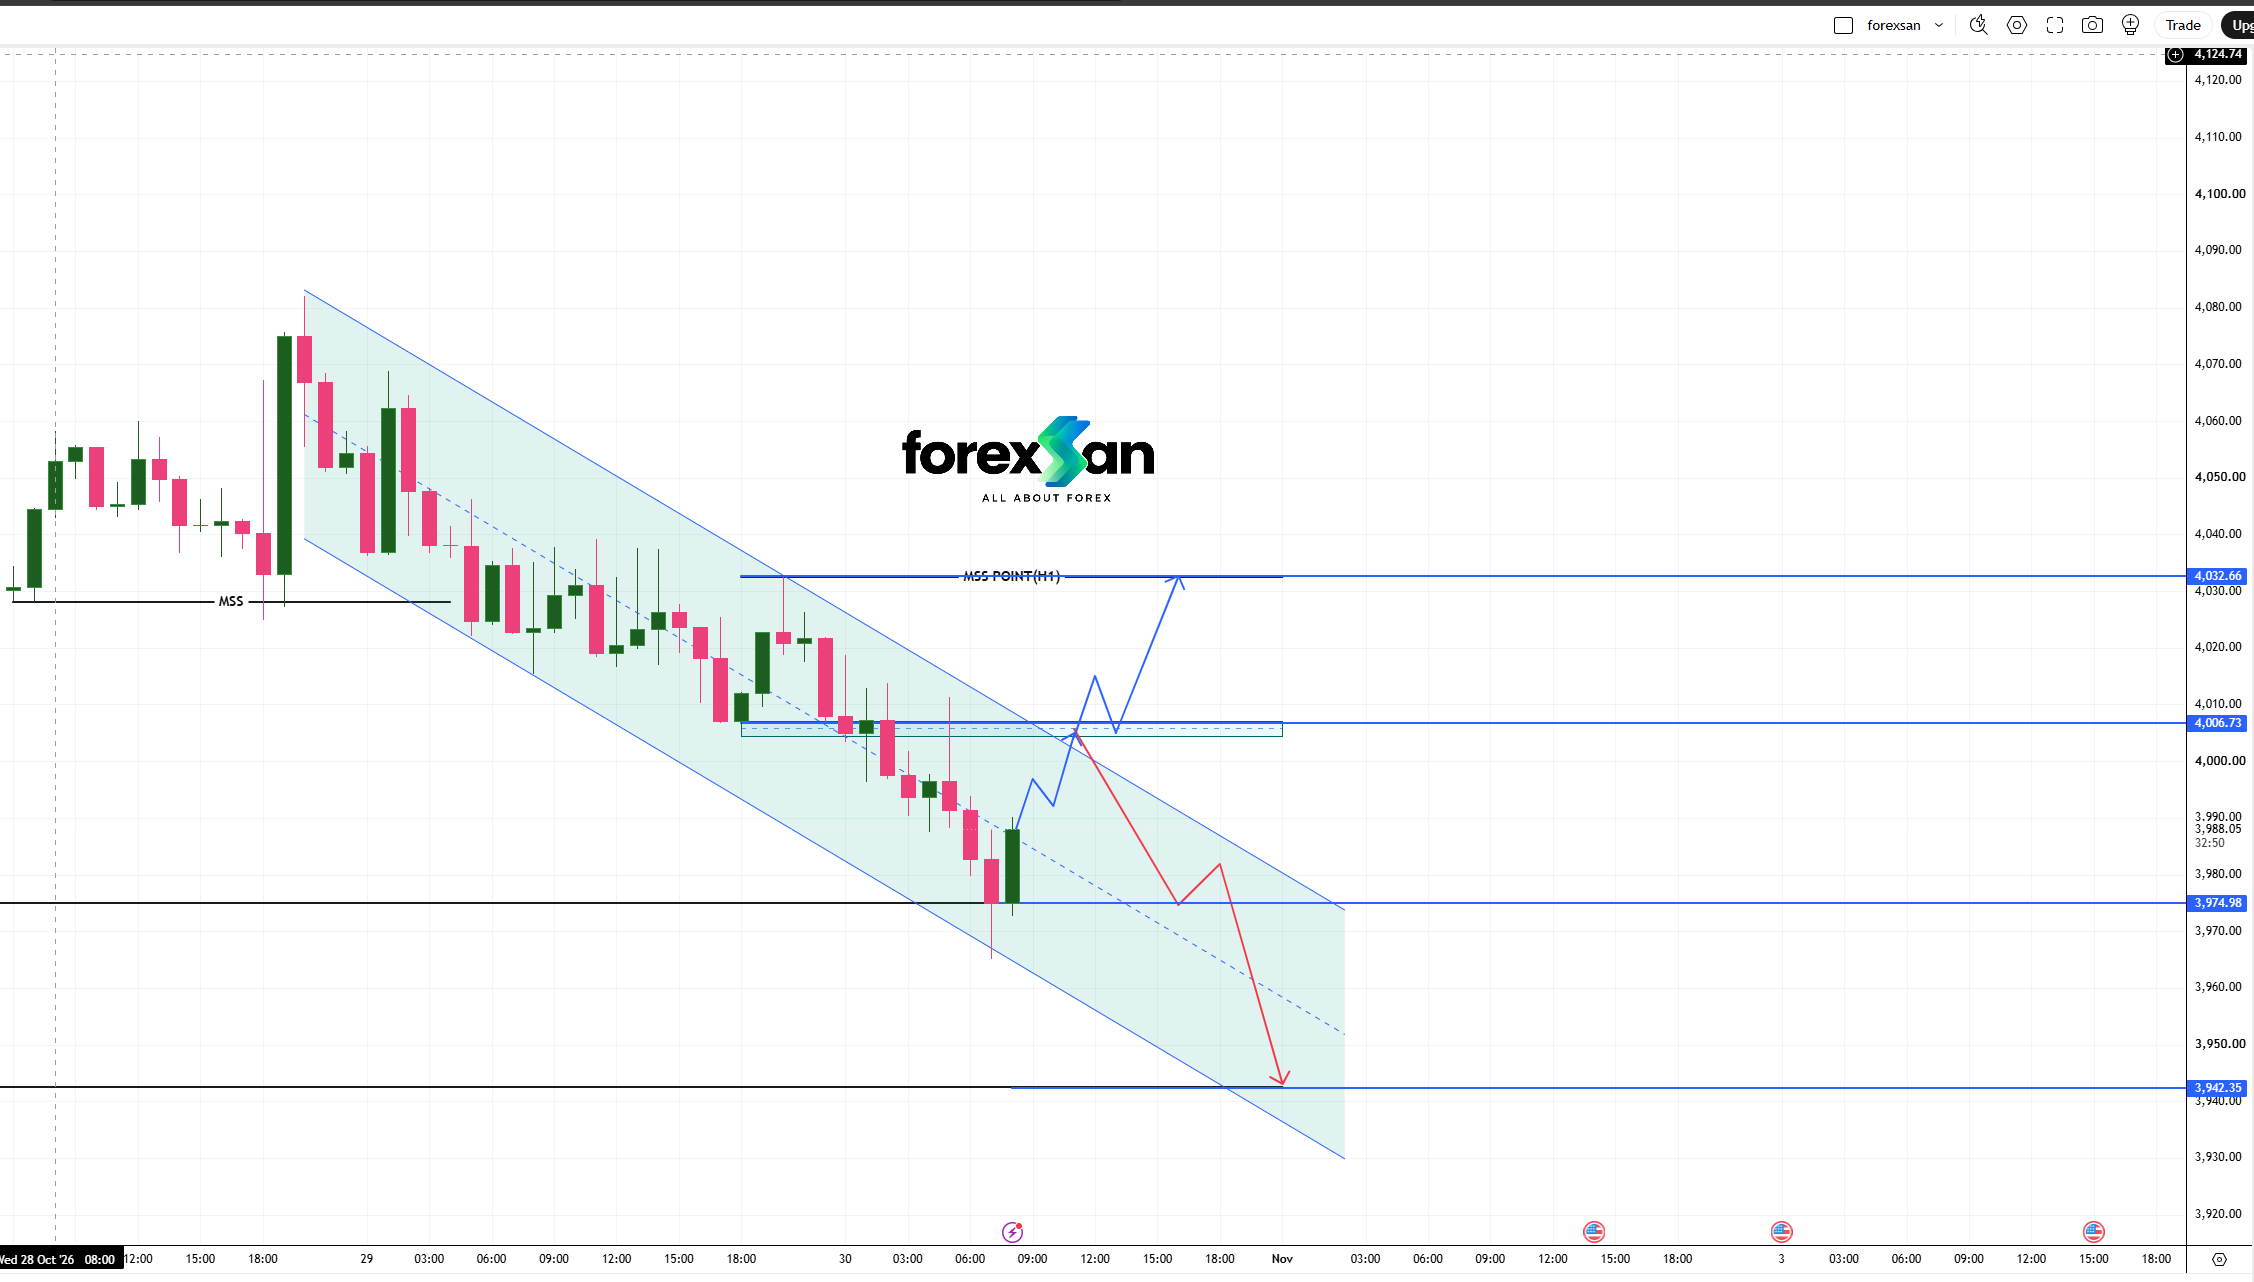
Spot Gold (XAU/USD) is continuing to trade within a well-defined **Descending Parallel Channel** on the 1-hour chart. Price is staging a short-term pullback toward channel mid-line resistance at **4,006.73**. This structural junction provides a dual-scenario outlook, mapping out clear criteria for both trend continuation and corrective expansion....

ForexSan Analysis Team
30/10/2026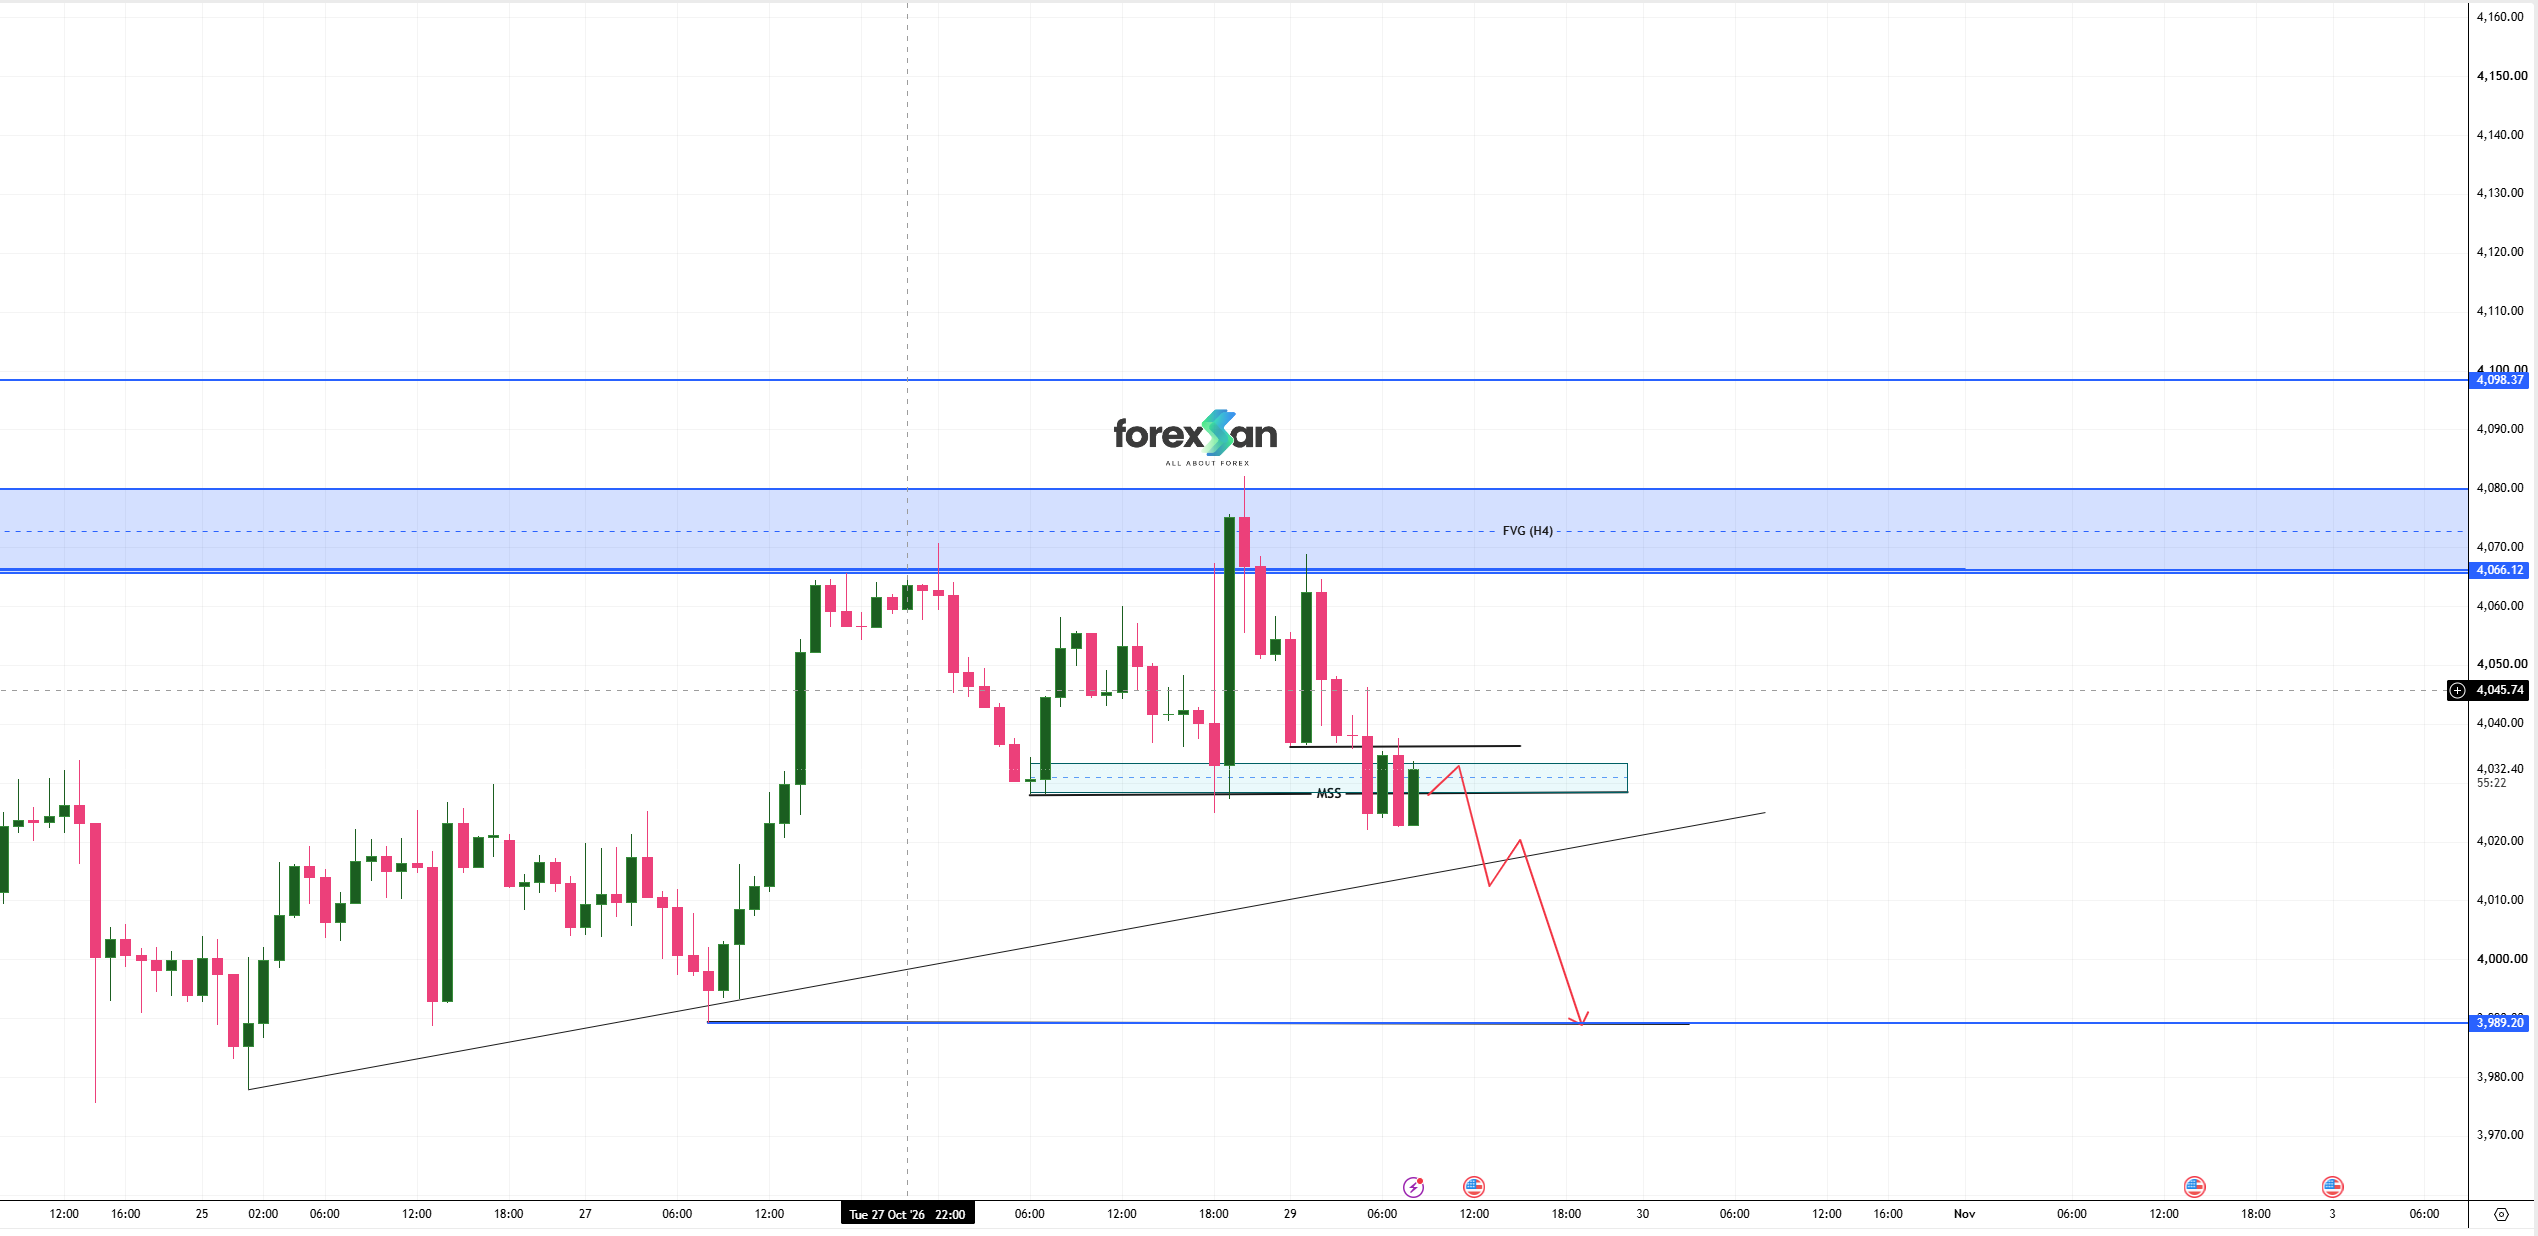
Spot Gold (XAU/USD) has encountered significant selling pressure at the **4,066.12 – 4,098.37 H4 Fair Value Gap (FVG)** resistance band. Following this rejection, price action broke below local higher-low structure, confirming a **Market Structure Shift (MSS)**. The market is currently undergoing a minor corrective pullback to retest the newly formed MSS supply block around **4,032.40**, setting up a bearish continuation framework toward lower demand....
ForexSan Analysis Team
29/10/2026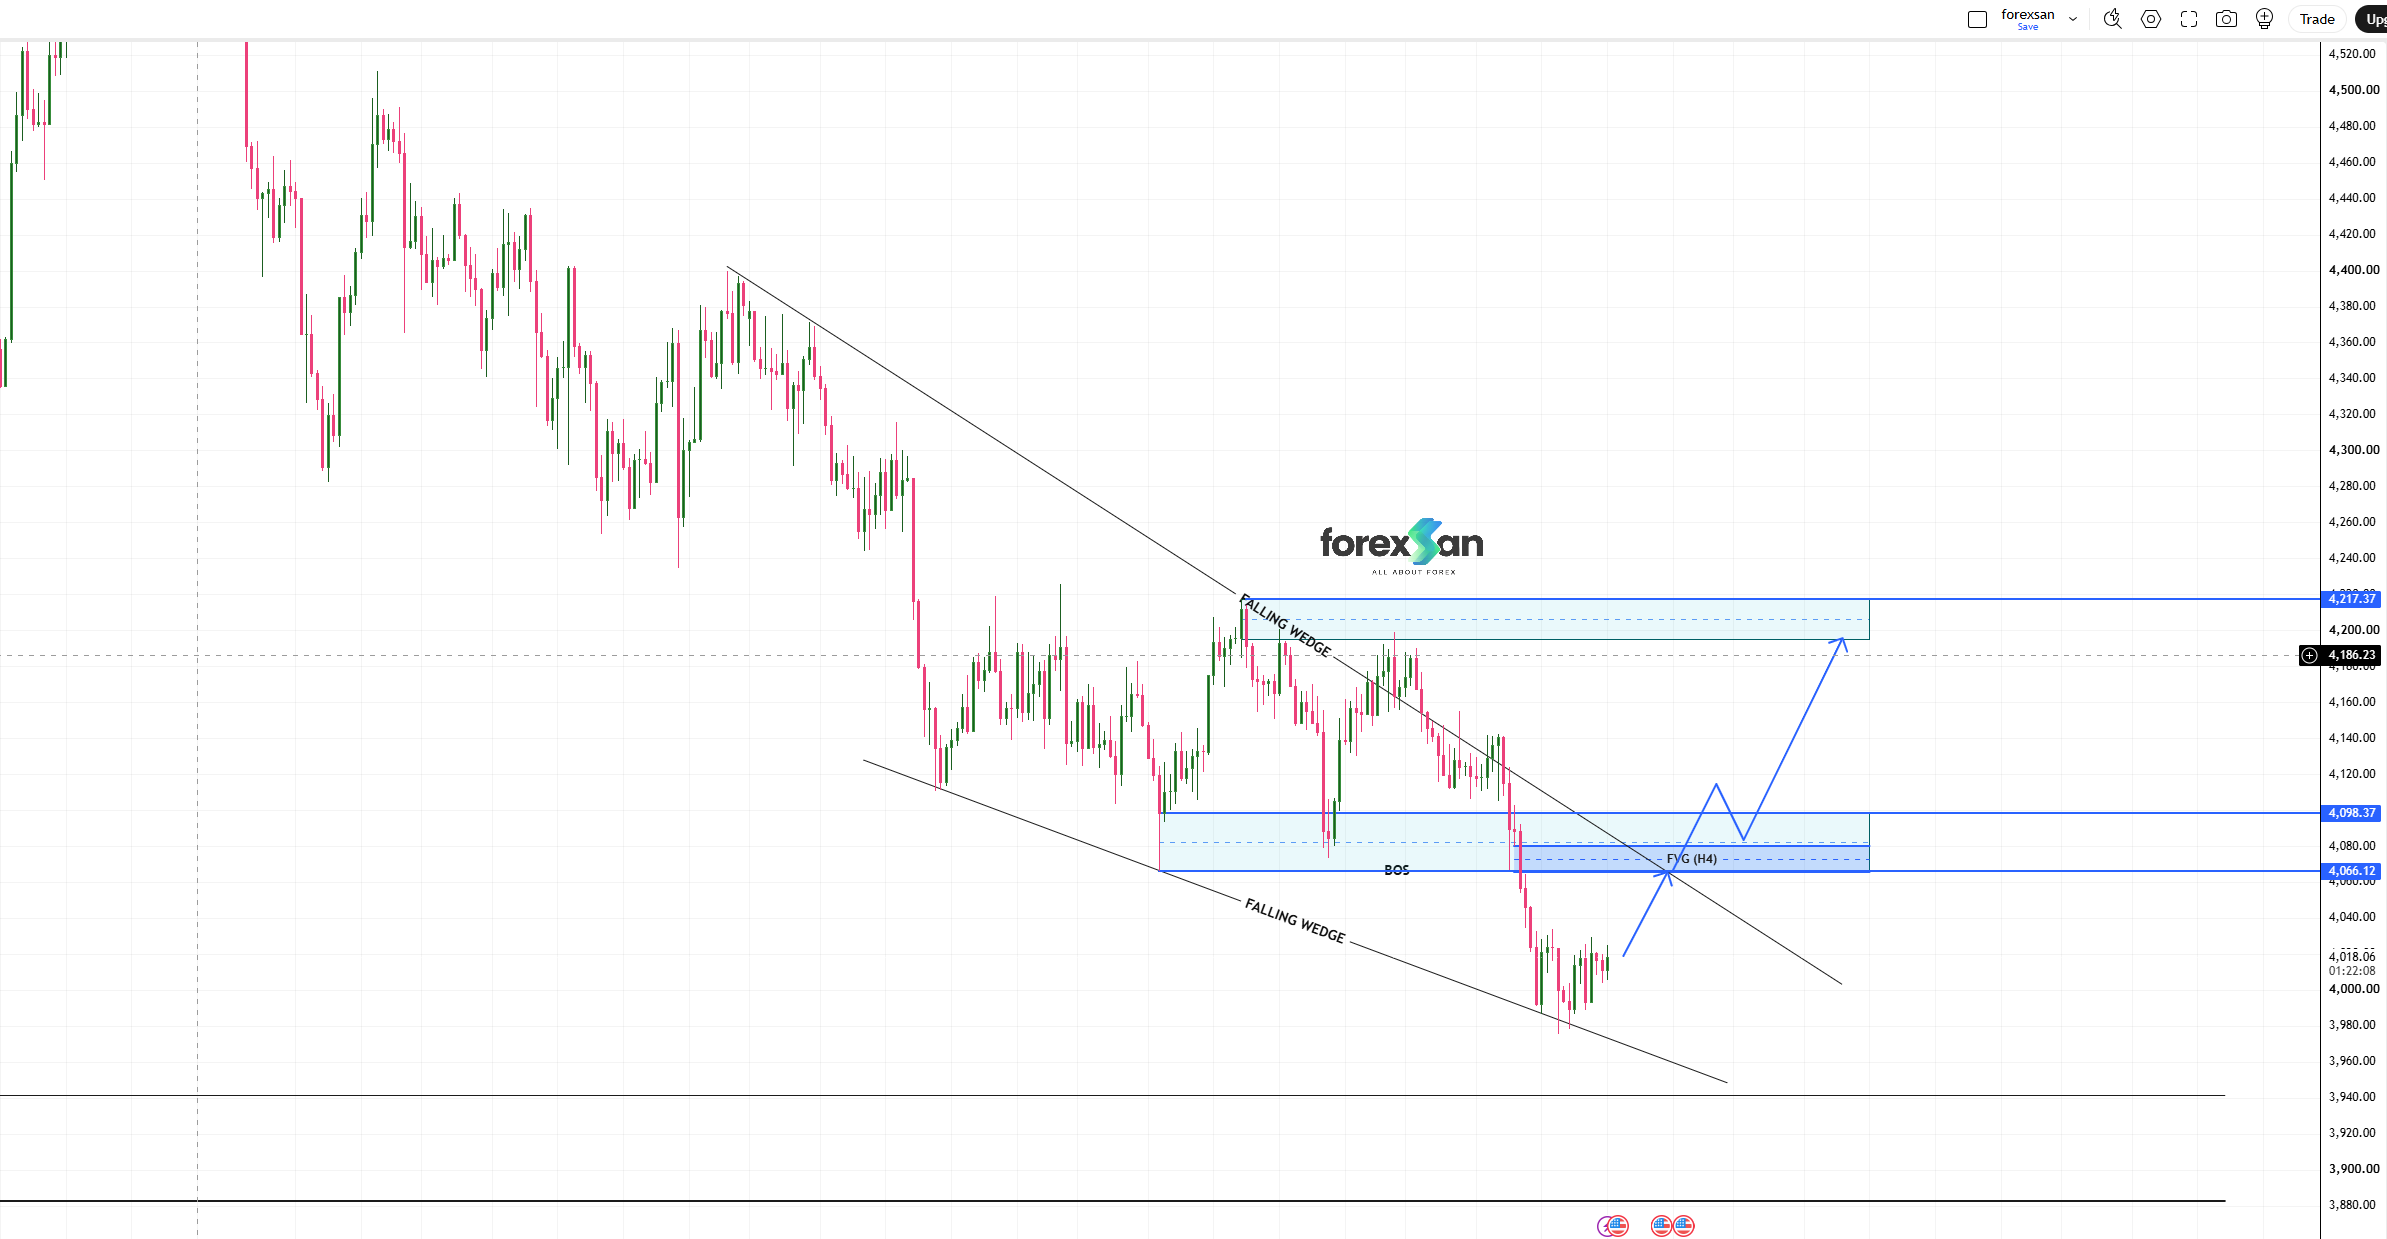
Spot Gold (XAU/USD) has completed an institutional liquidity sweep at the lower boundary of a **Falling Wedge** pattern near the **3,990.00** region. Price action has executed a sharp impulse move upward, breaking out of the upper trendline and testing the H4 Fair Value Gap (FVG) / Break of Structure (BOS) zone between **4,066.12** and **4,098.37**. This sets up a high-confluence retest scenario targeting top-side supply objectives....
ForexSan Analysis Team
27/10/2026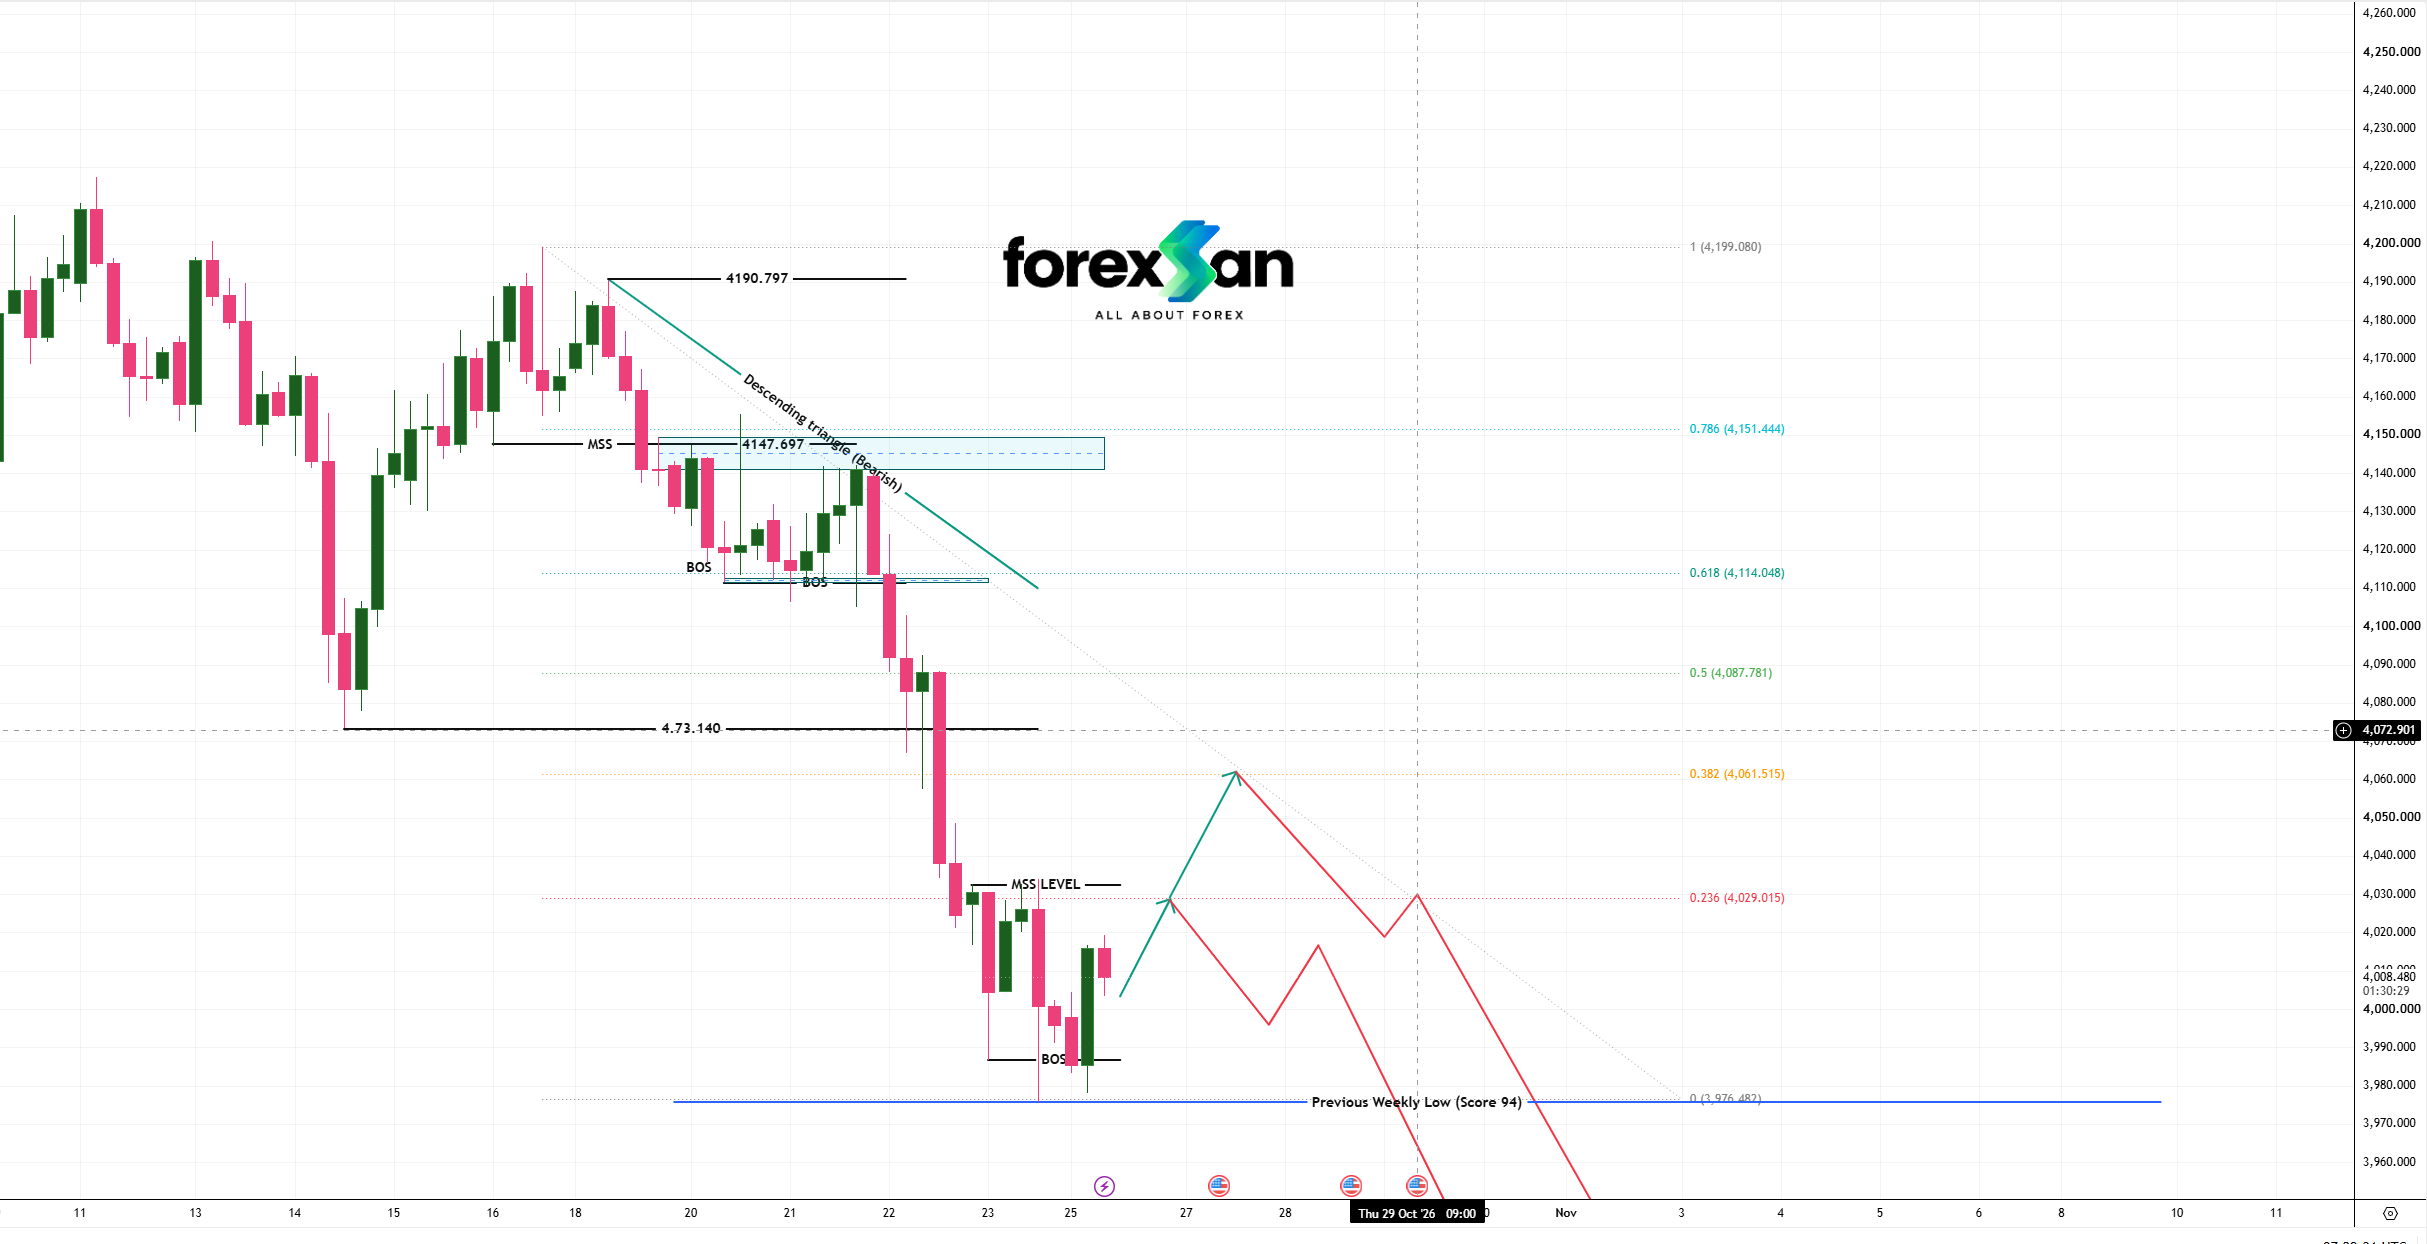
Spot Gold (XAU/USD) has established a temporary local bottom near 3,985.00 following a sharp impulse move to the downside. Price action is currently entering a corrective retracement phase, with order flow targeting Fibonacci resistance levels at 4,029.015 (0.236 Fib) and 4,061.515 (0.382 Fib) prior to an anticipated resumption lower toward the Previous Weekly Low at 3,976.482....
ForexSan Analysis Team
26/10/2026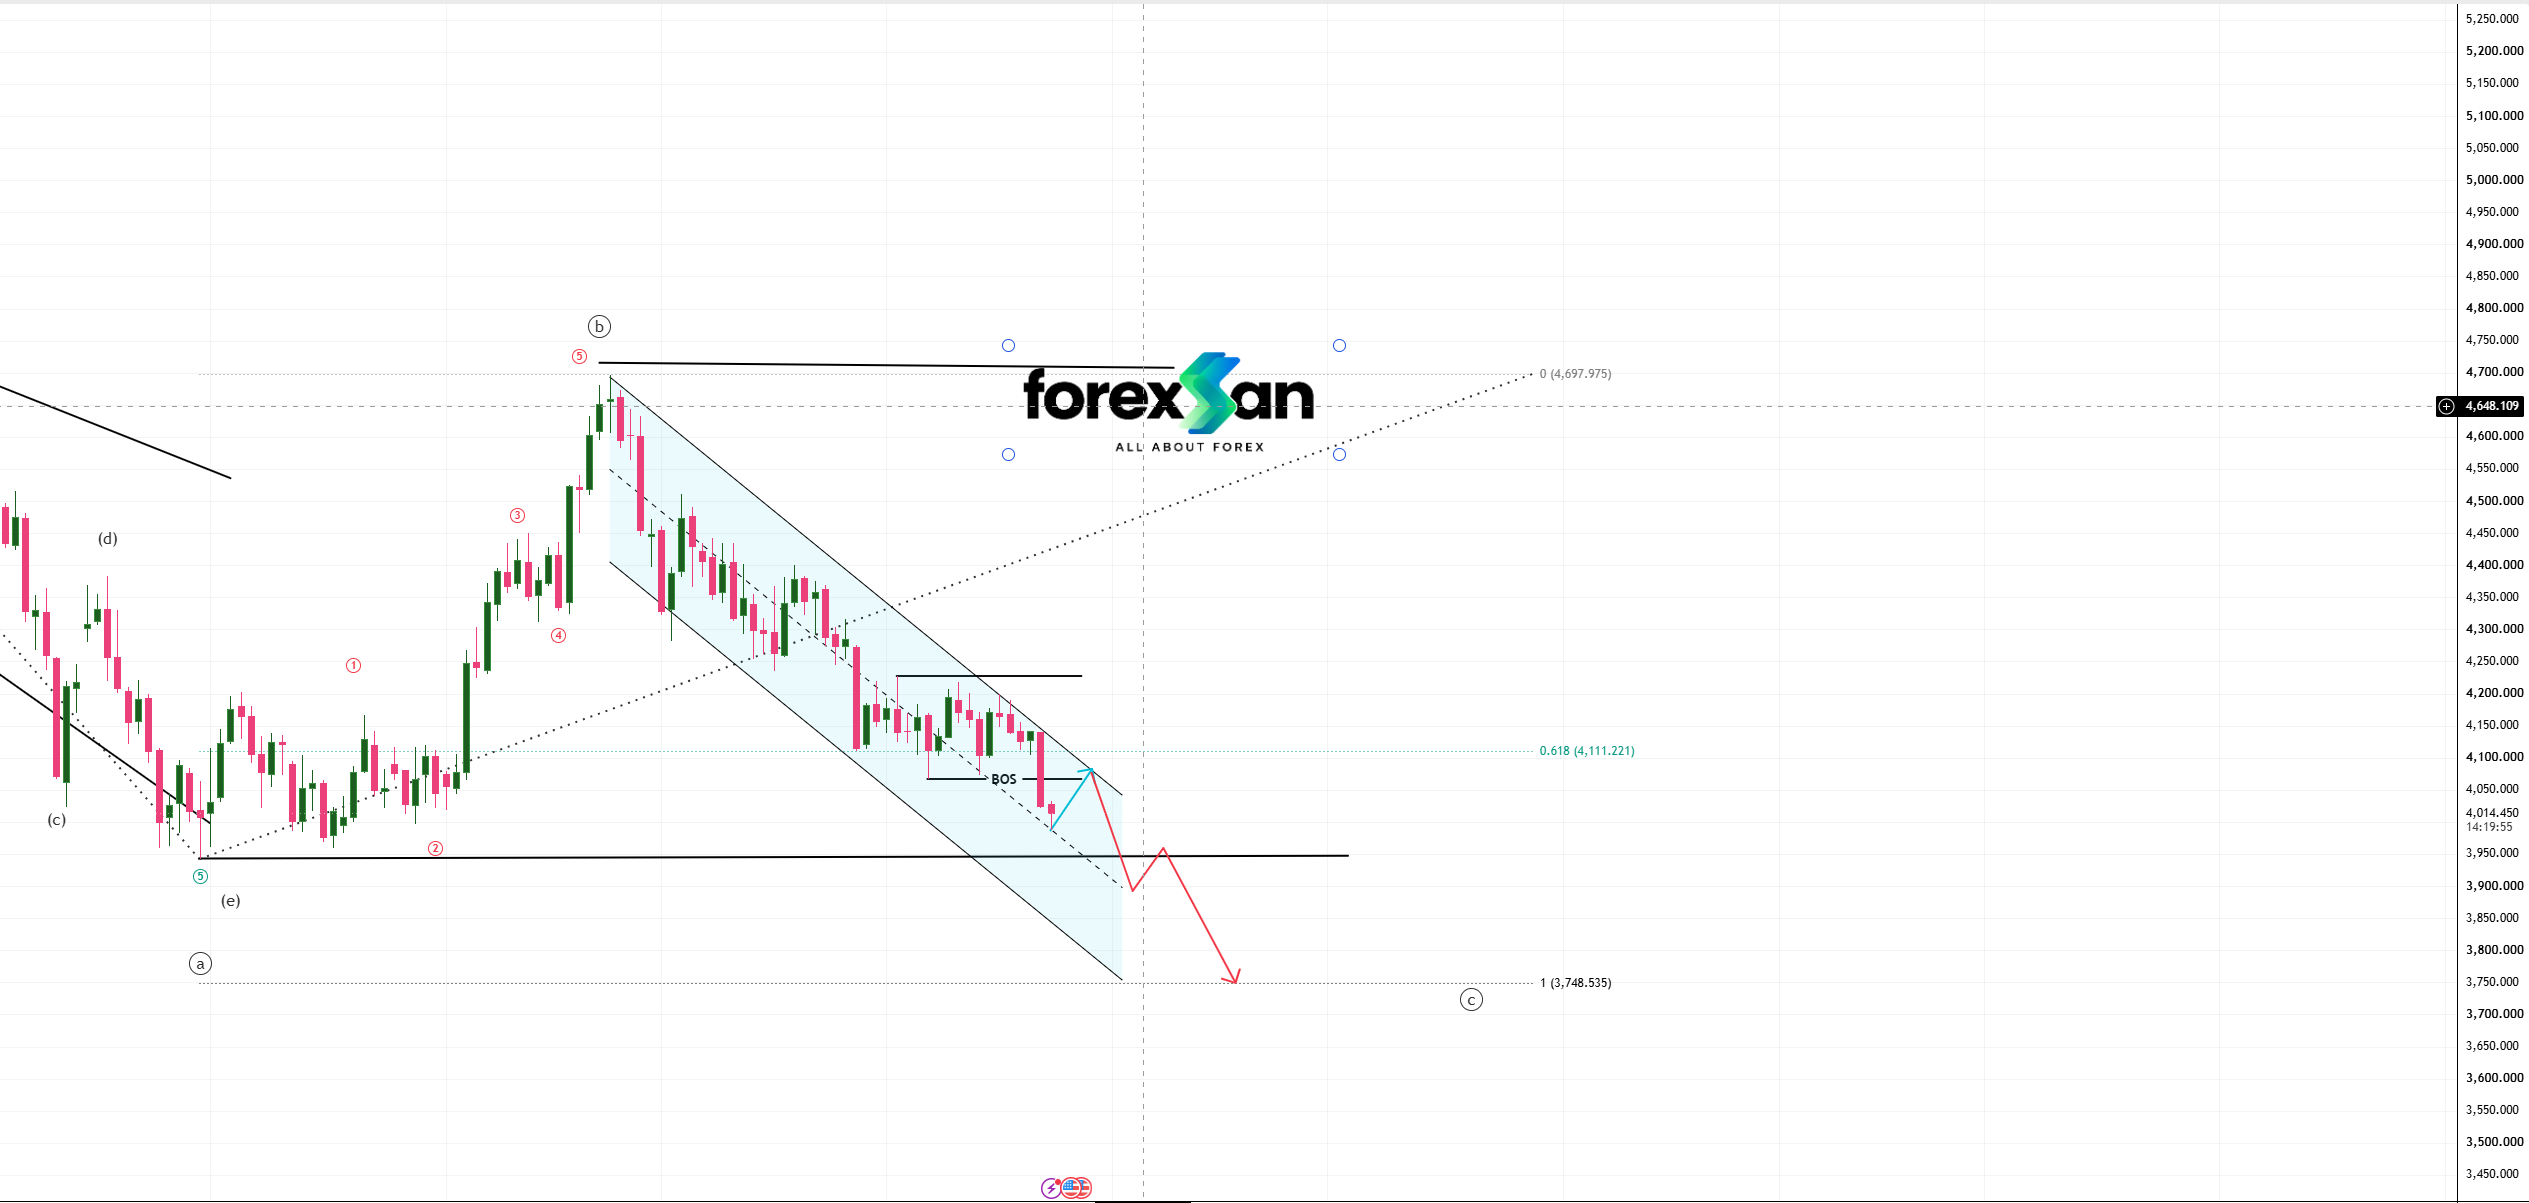
Spot Gold (XAU/USD) is continuing its broader bearish expansion following the completion of Wave (b) at **4,697.975**. Price action is currently structured within a **Descending Parallel Channel** on the daily/H4 framework. A minor corrective pullback is currently underway toward the **0.618 Fibonacci level (4,111.221)**, presenting a key lower-high retest zone before the primary Wave (c) projection unfolds....
ForexSan Analysis Team
23/10/2026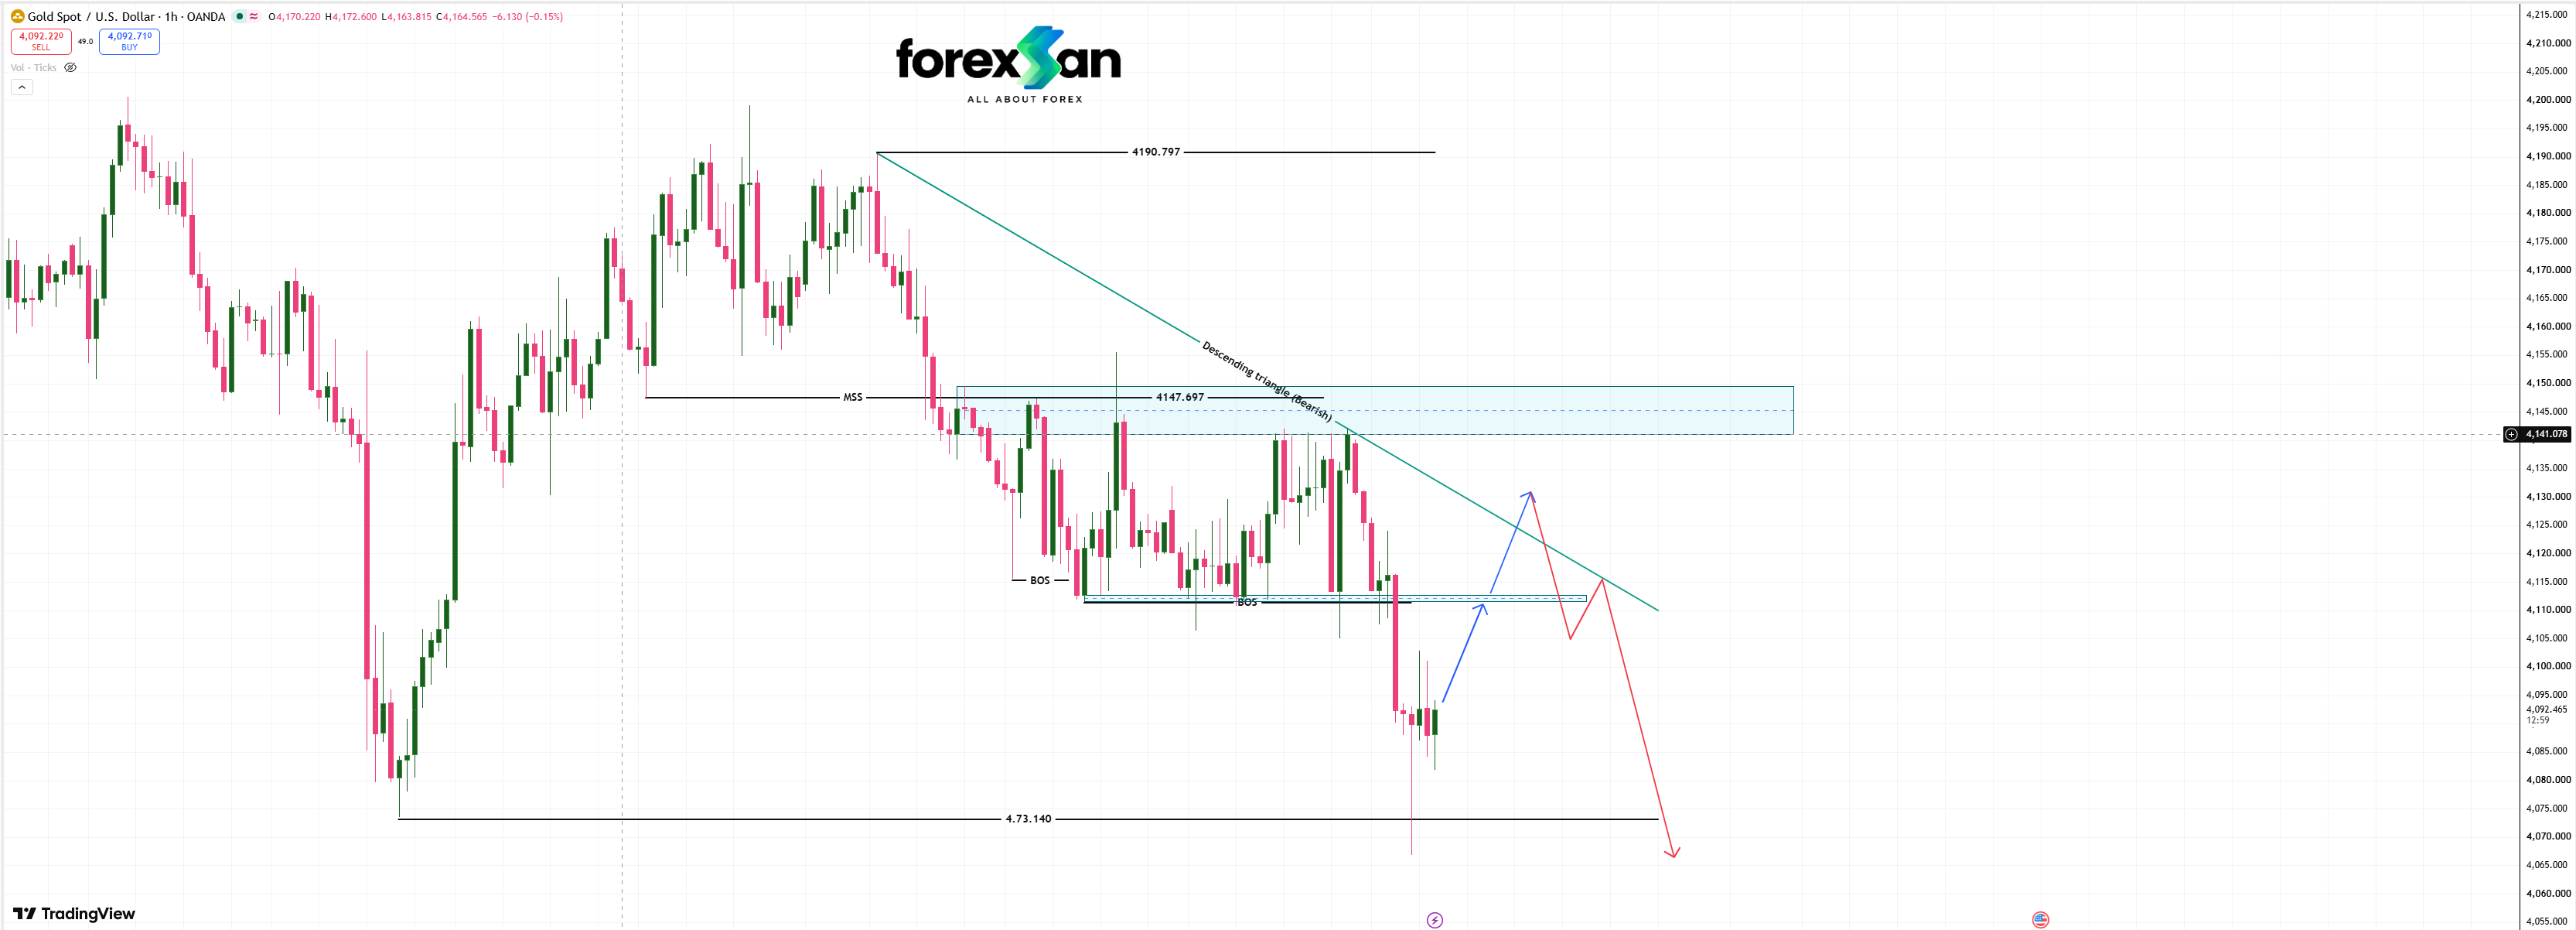
Spot Gold (XAU/USD) has confirmed a bearish breakout from its 1-hour **Descending Triangle** pattern, breaching the horizontal support floor at **4,115.00**. Price action is currently staging a short-term pullback to retest the broken support zone as new resistance, laying the groundwork for a continuation leg lower toward primary structural support....
ForexSan Analysis Team
22/10/2026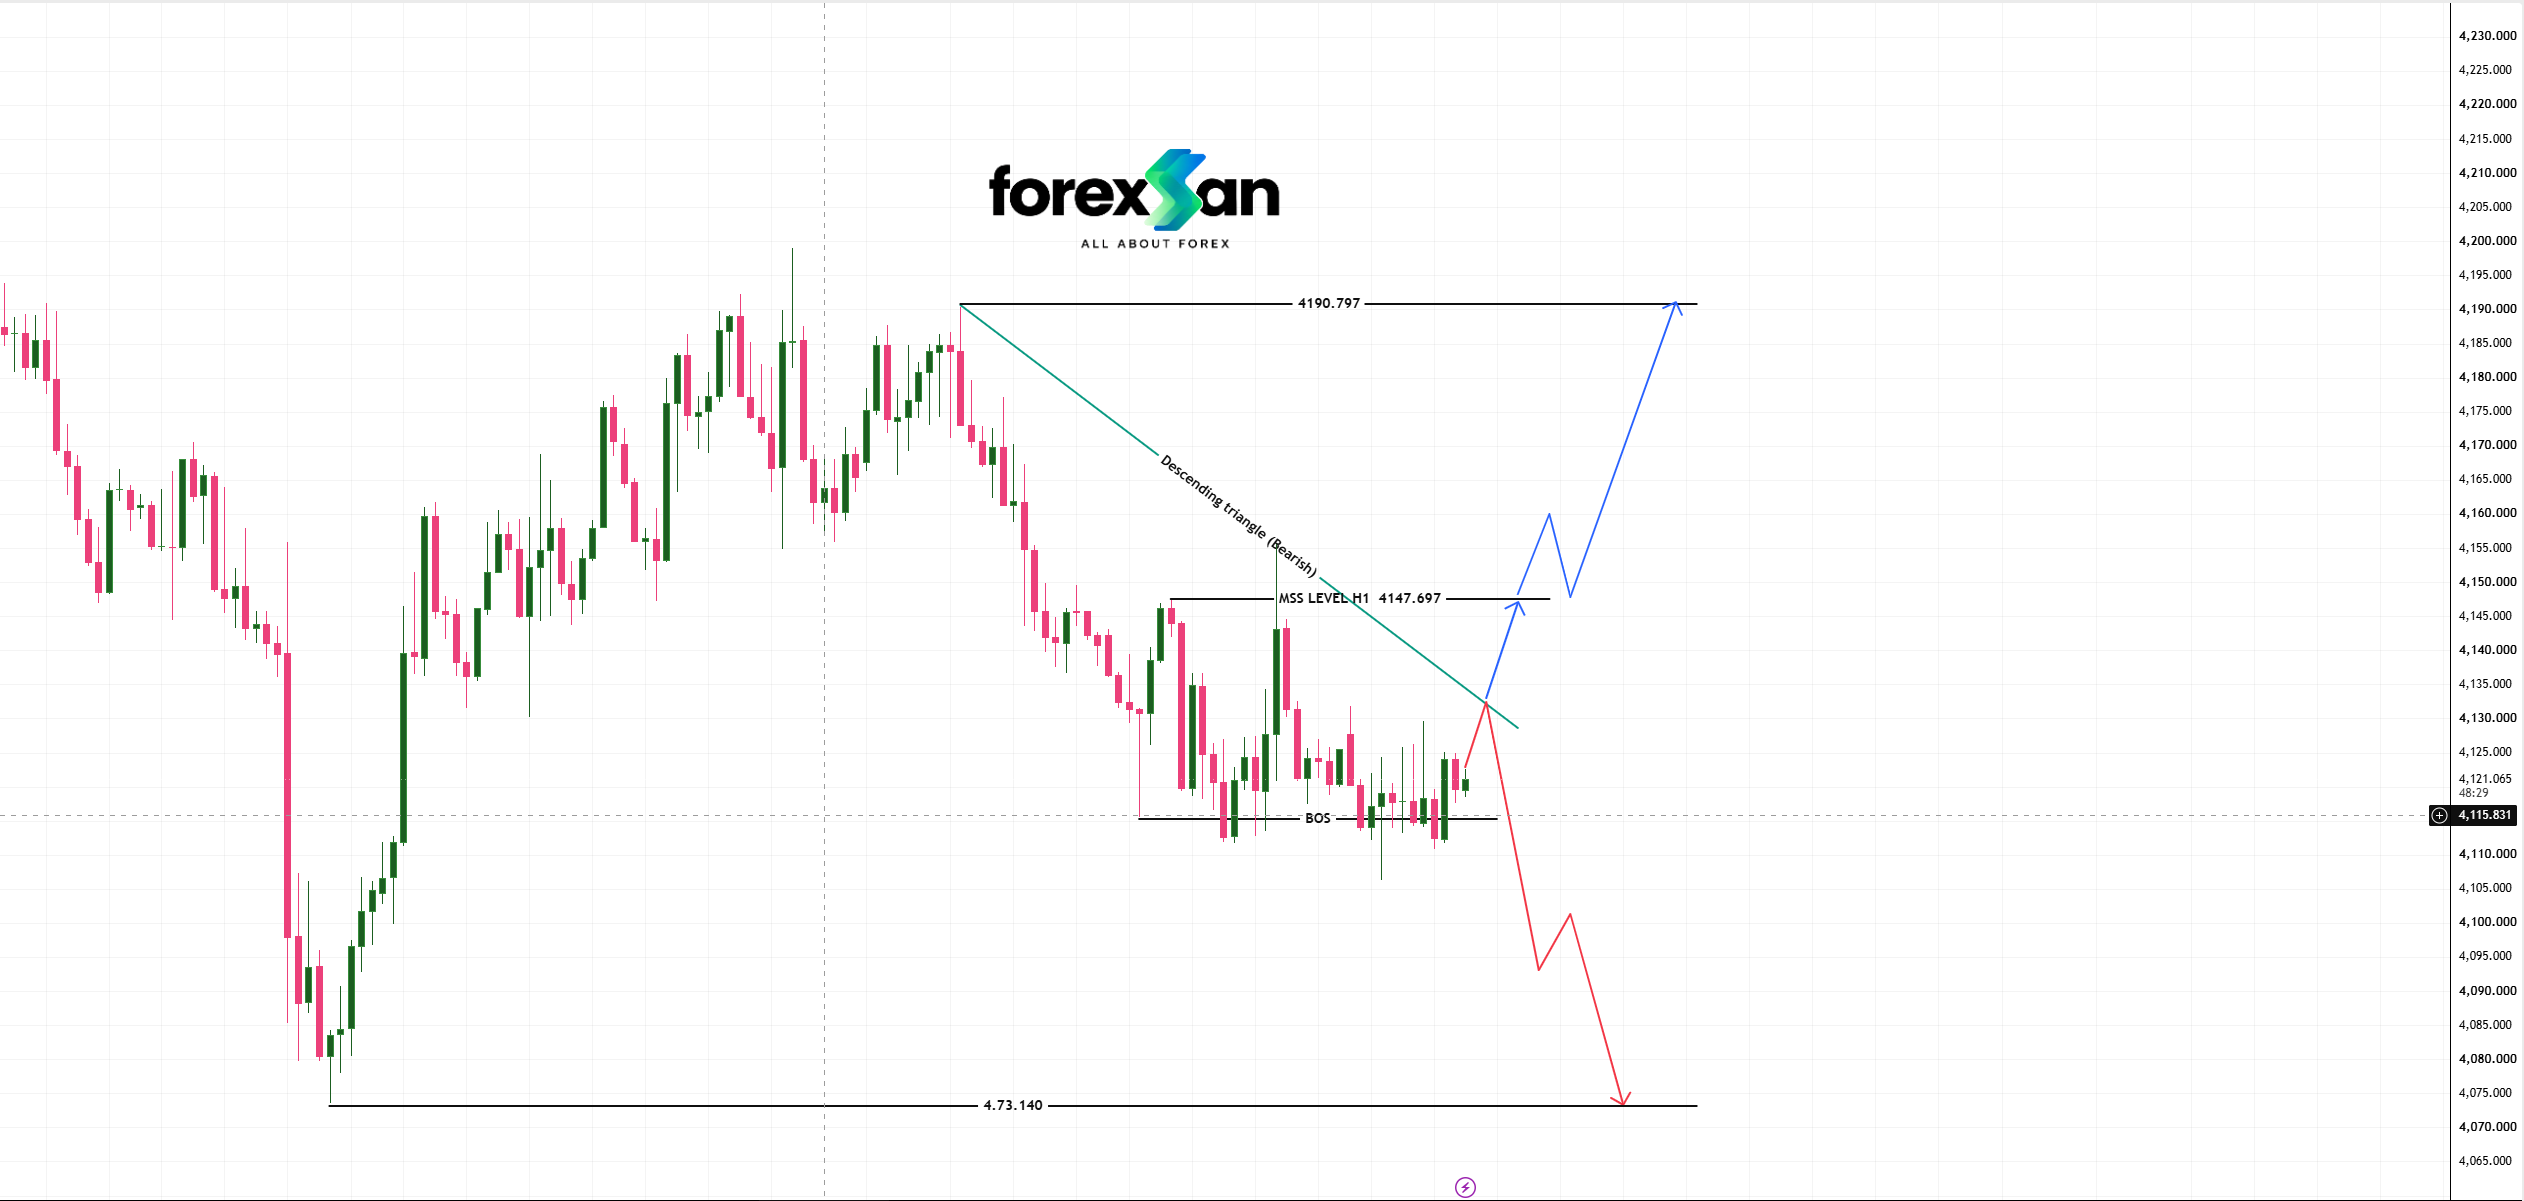
Spot Gold (XAU/USD) is consolidating within a **Descending Triangle** formation on the 1-hour timeframe. Price is compressing between lower horizontal support at **4,115.831** and descending trendline resistance. This structure sets up a dual-scenario framework depending on whether buyers can secure a Market Structure Shift (MSS) or if sellers force a breakdown....
ForexSan Analysis Team
21/10/2026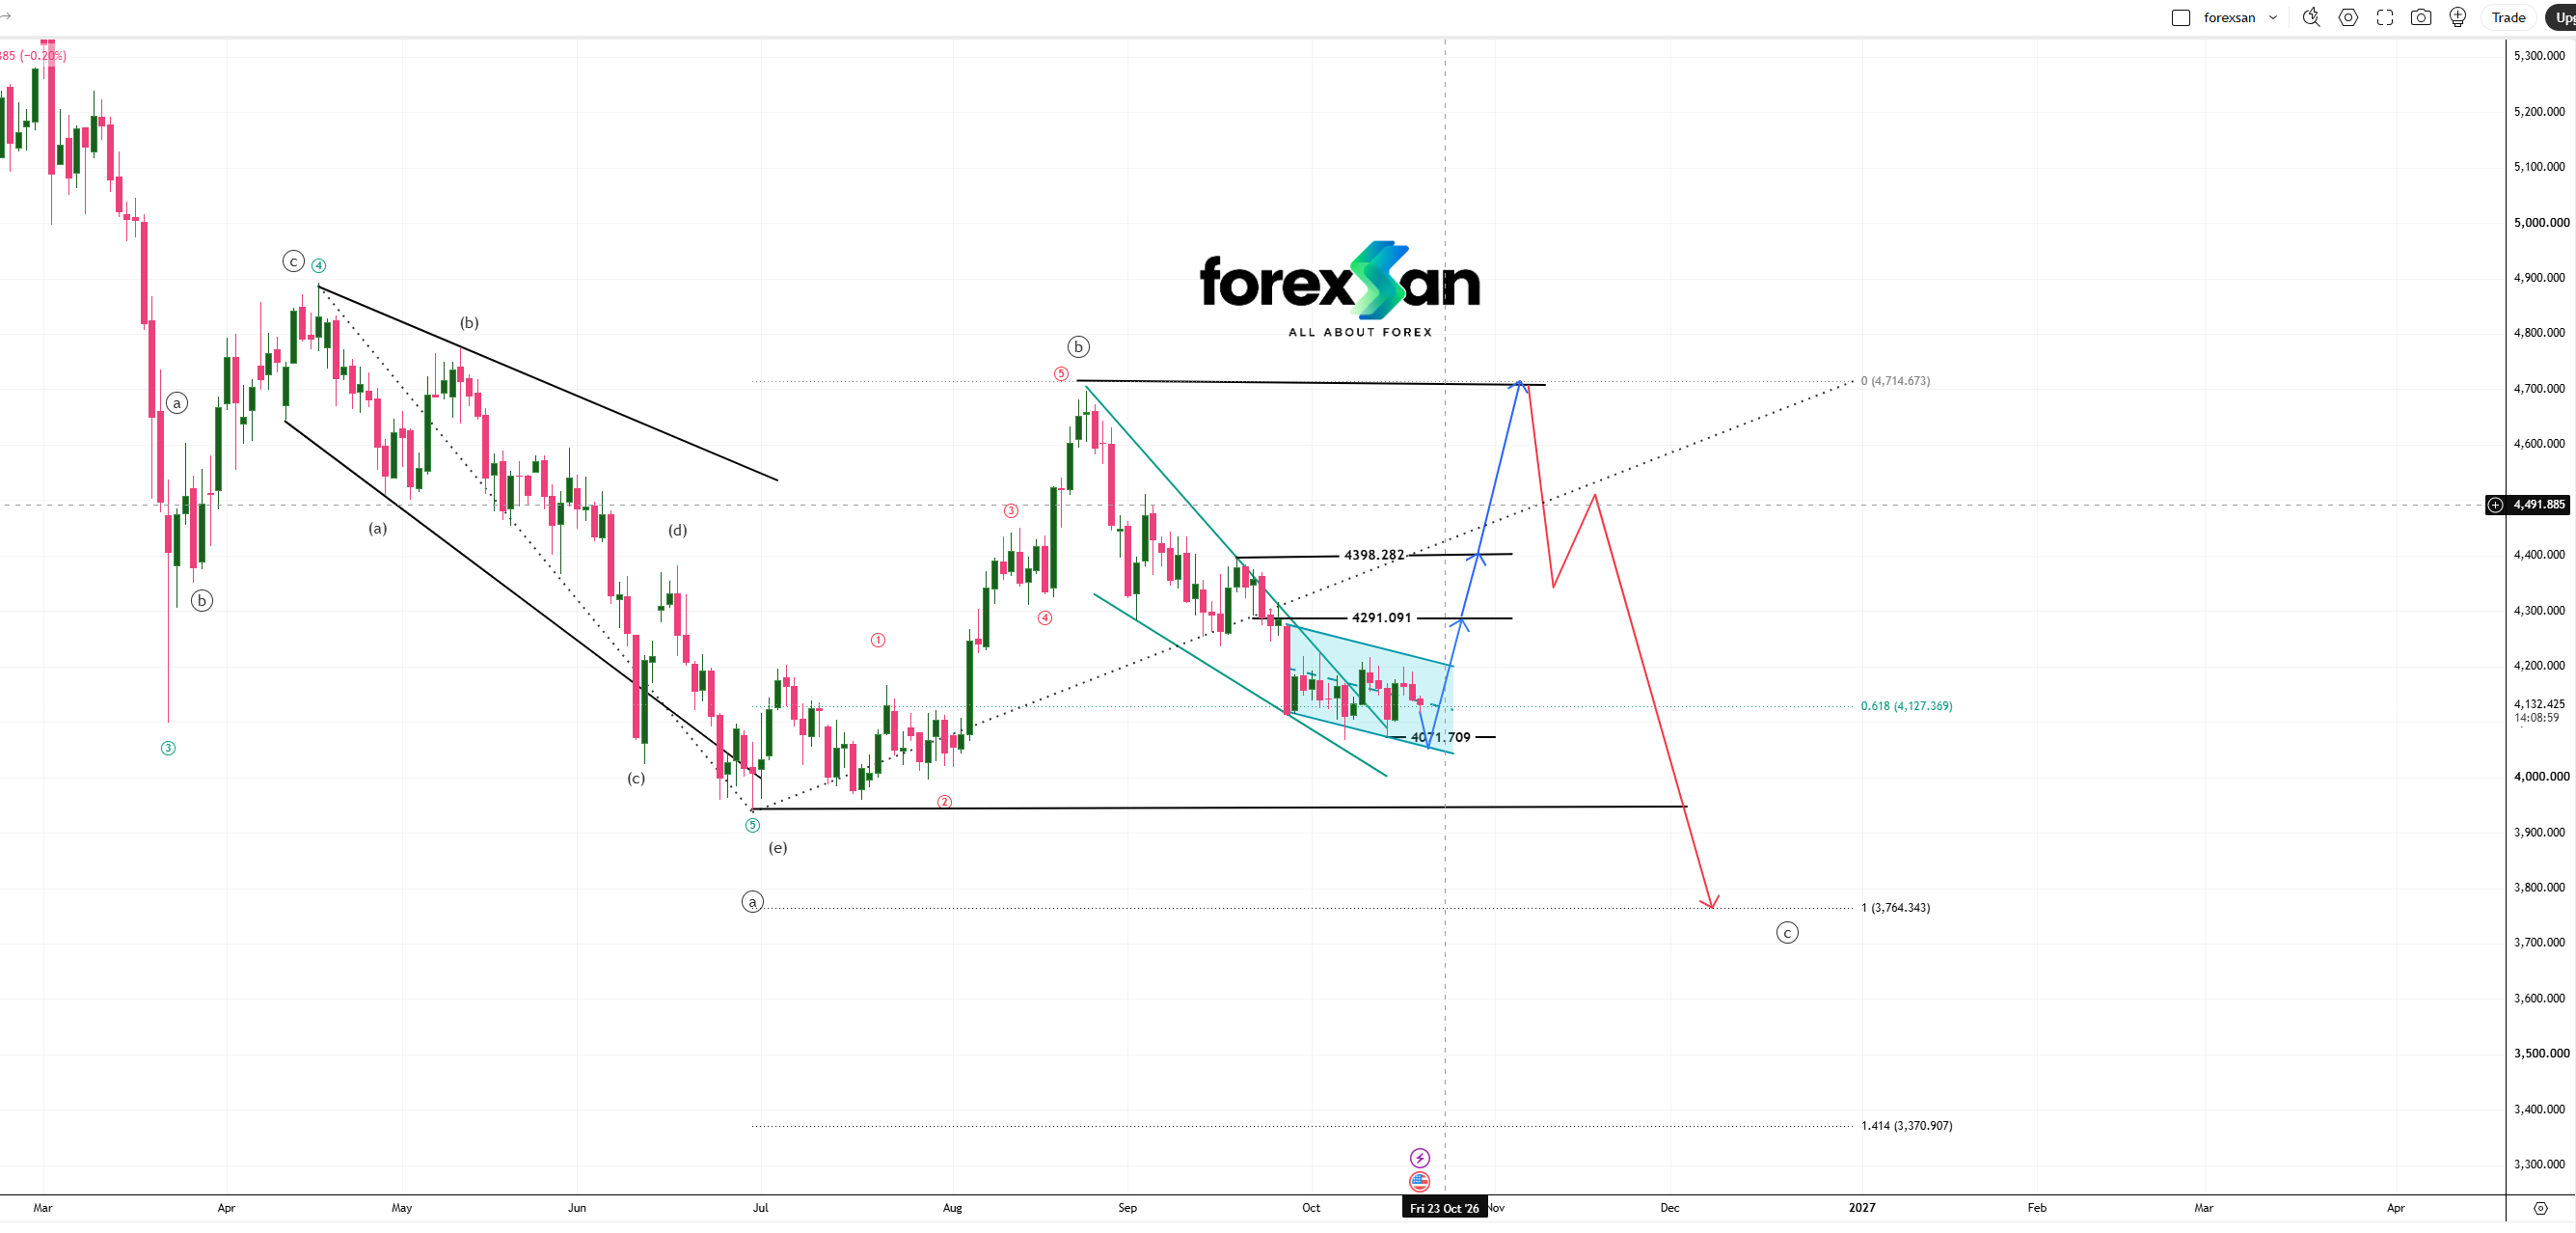
Spot Gold (XAU/USD) has completed its local corrective leg, finding strong buyer demand above the **0.618 Fibonacci level (4,127.369)** and structural support at **4,071.709**. Price action is breaking out of a bullish **Falling Wedge** pattern, pointing toward a multi-stage Elliott Wave (b) corrective rally before the overarching macro Wave (c) structure unfolds....
ForexSan Analysis Team
20/10/2026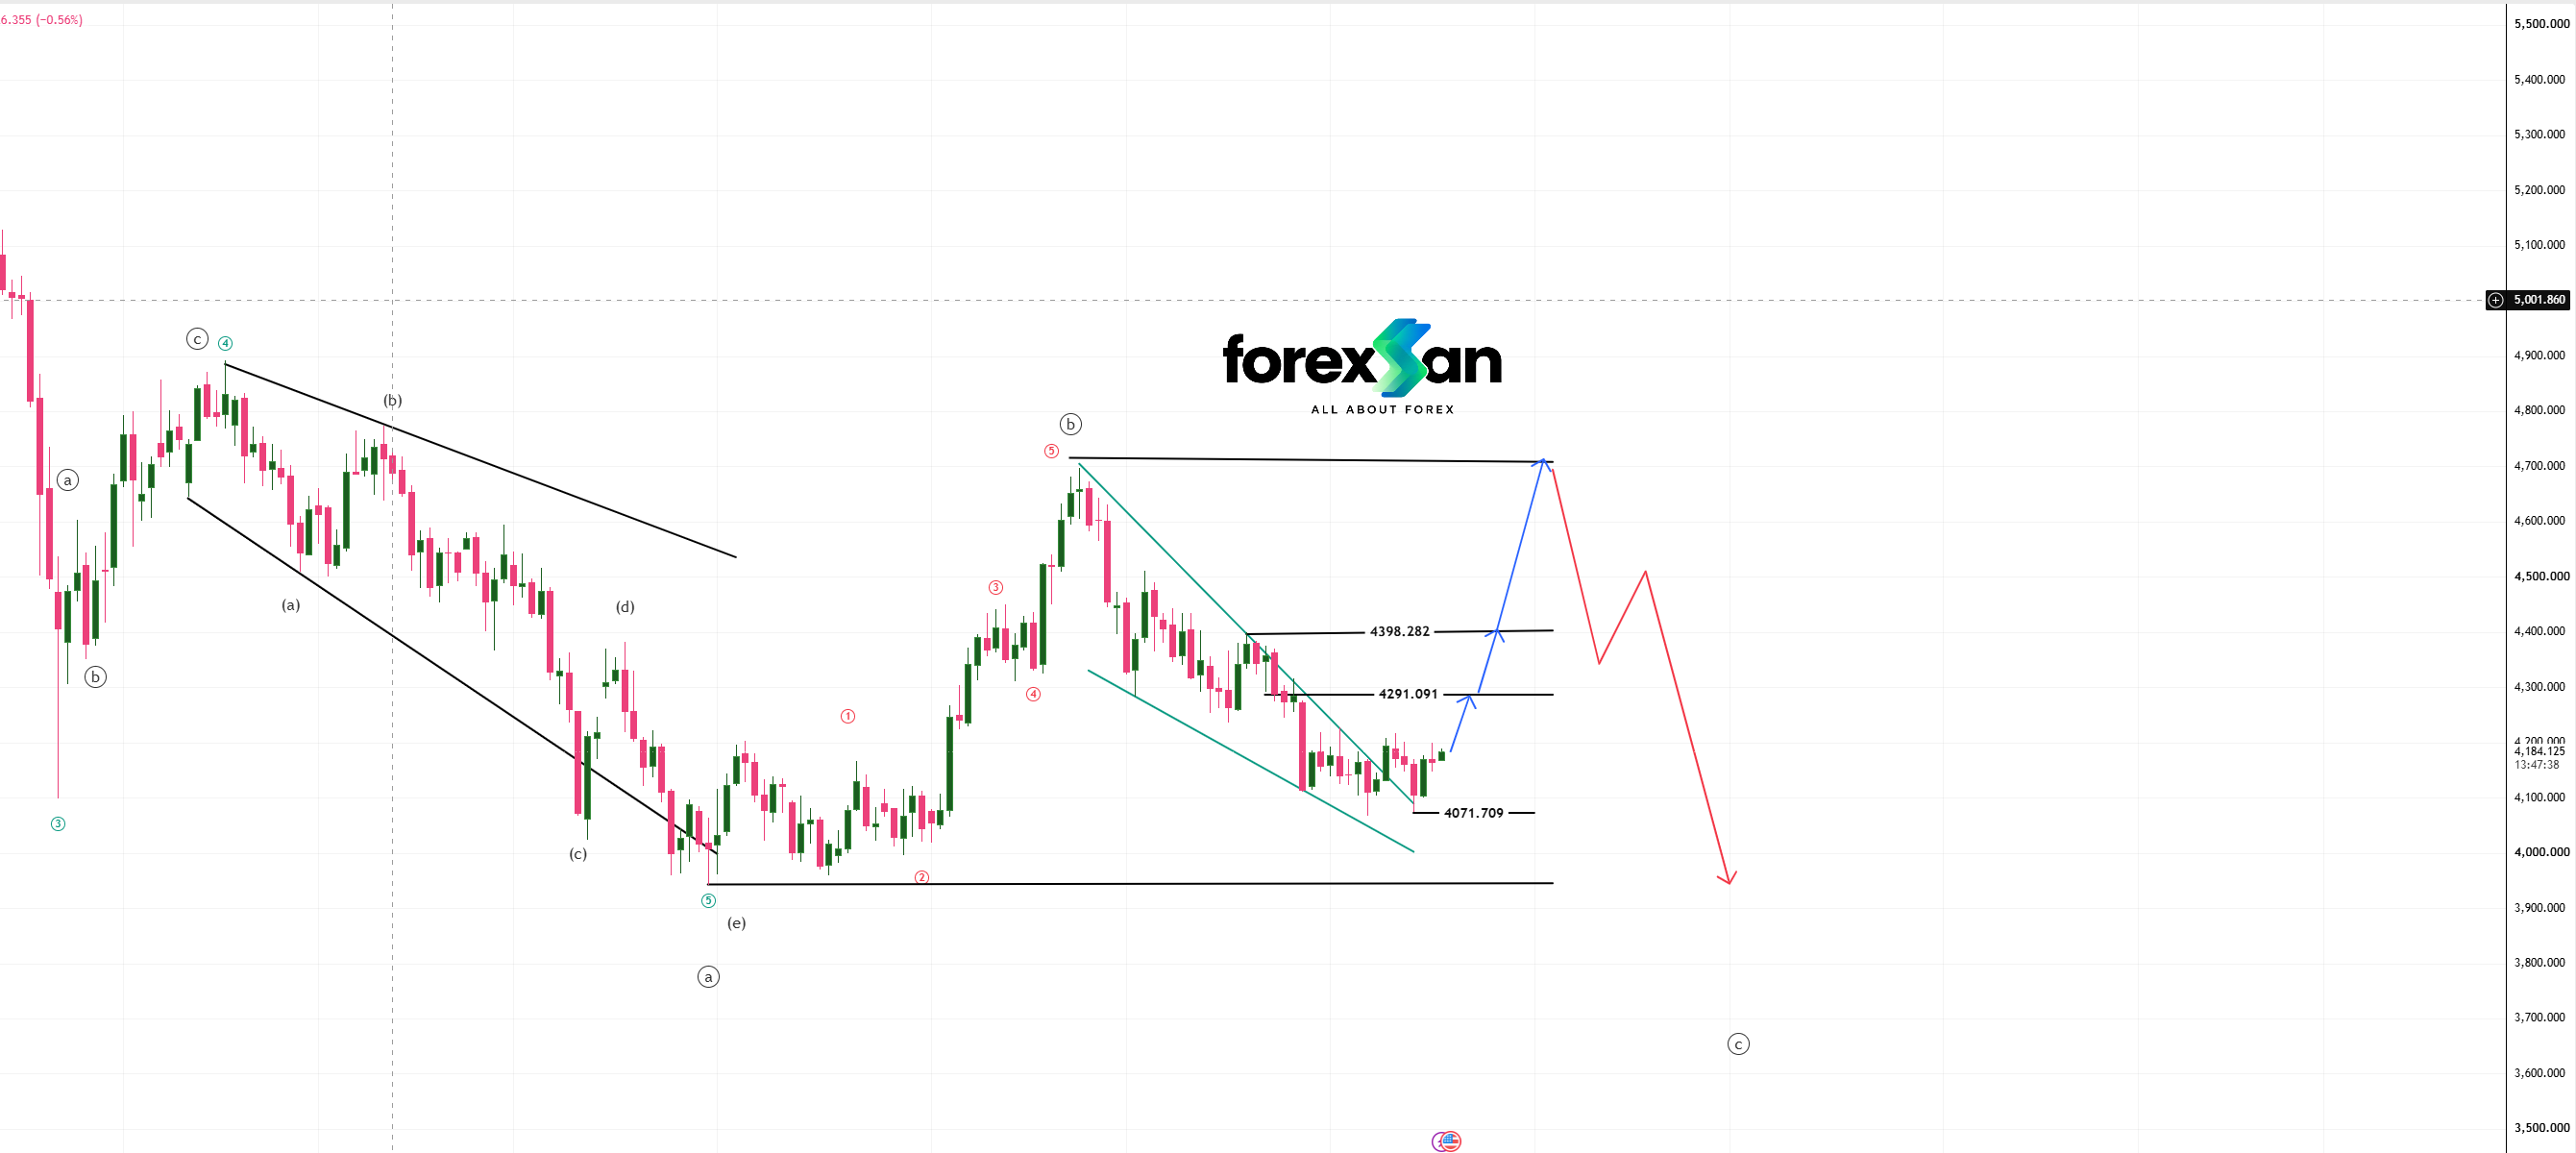
Spot Gold (XAU/USD) has completed its local corrective leg, establishing a firm support floor at 4,071.709. Price action is currently pushing out of a bullish Falling Wedge pattern, pointing toward a multi-stage Elliott Wave (b) corrective rally before the macro structure resumes....
ForexSan Analysis Team
19/10/2026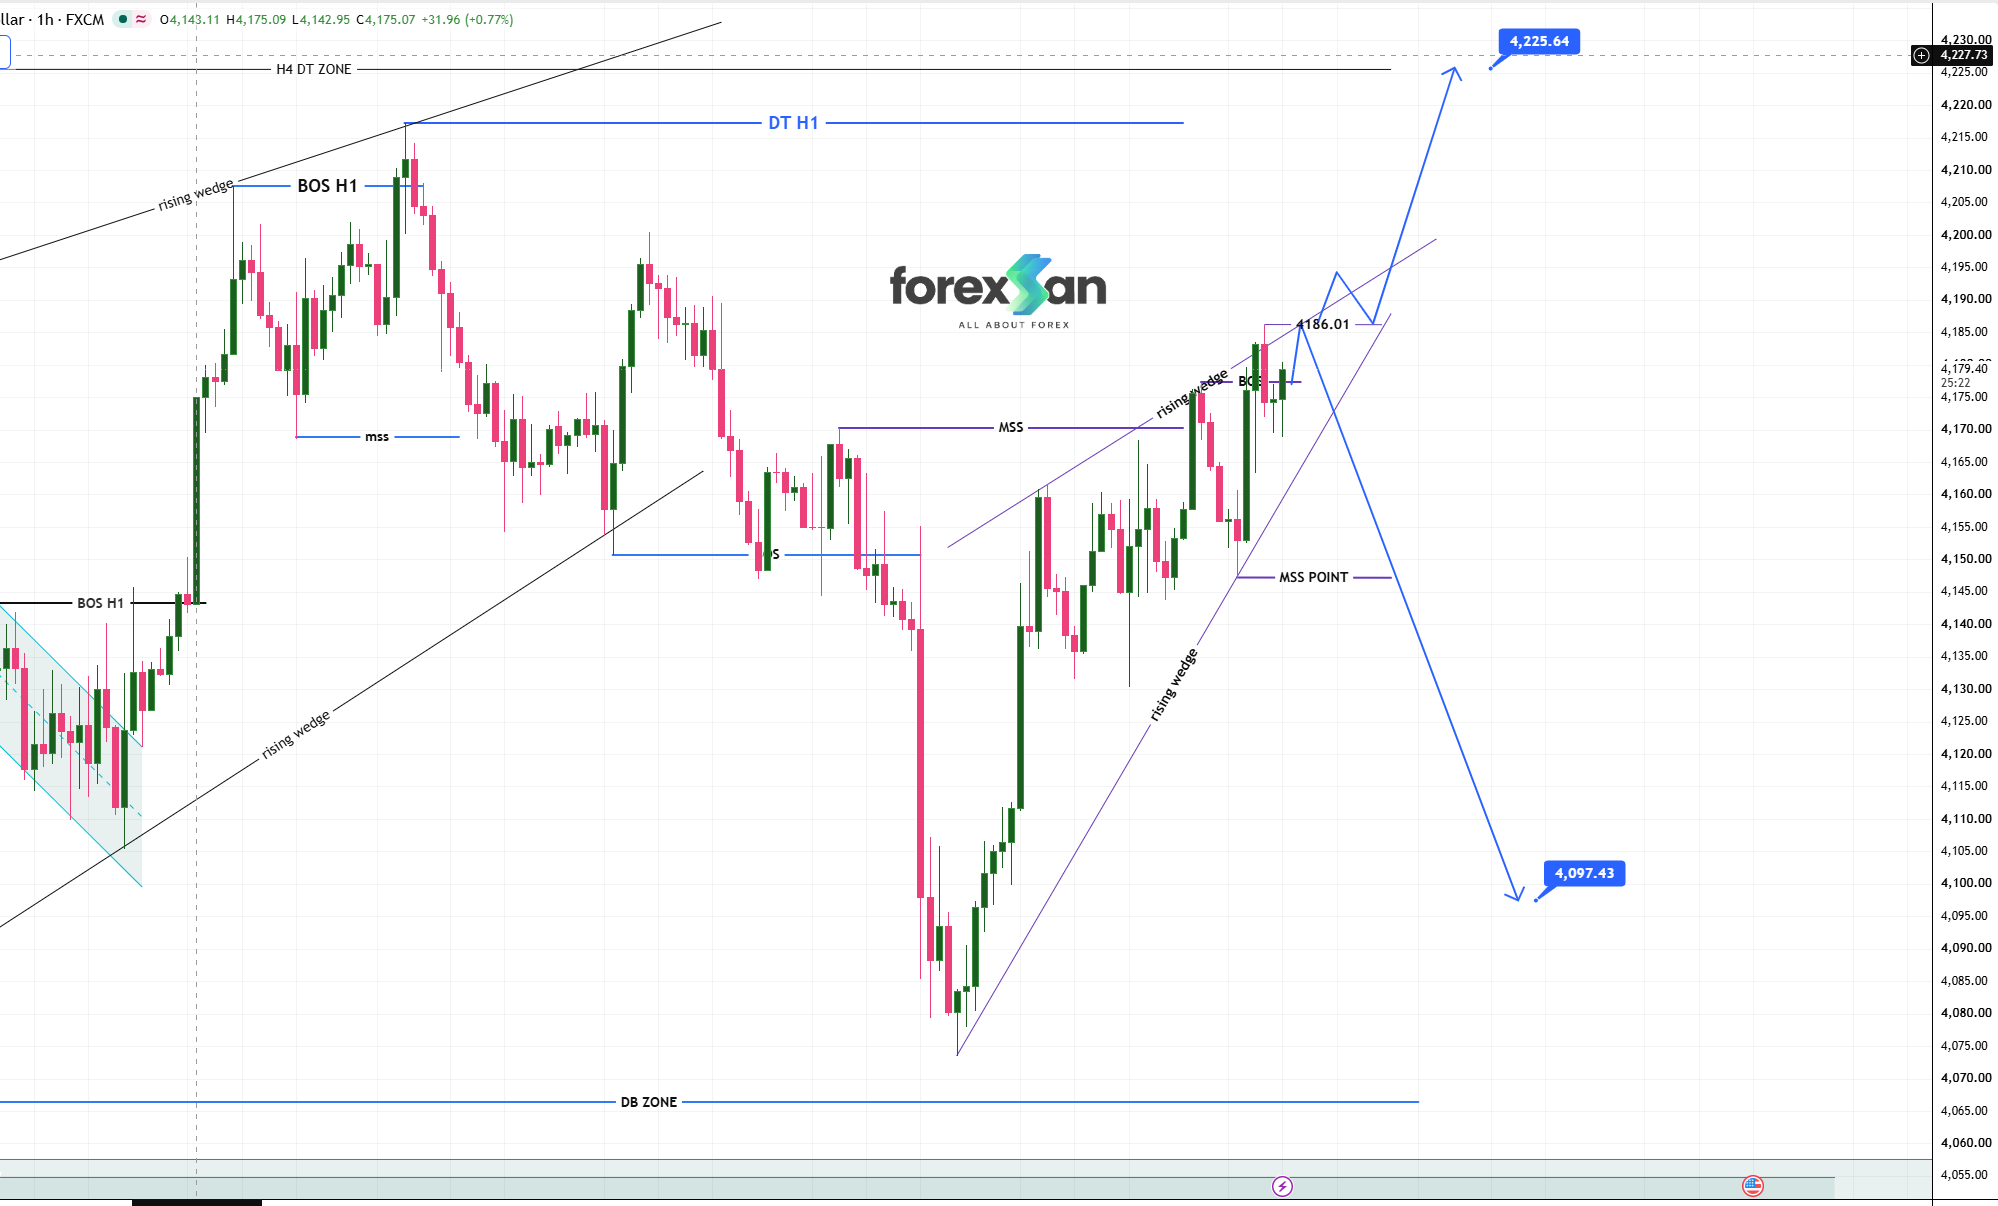
Spot Gold (XAU/USD) is trading at a critical technical juncture on the H1 timeframe. Following a sharp V-shaped recovery off local demand, price action is consolidating inside a developing rising wedge structure, establishing clear technical boundaries for both bullish expansion and corrective downside scenarios....
ForexSan Analysis Team
16/10/2026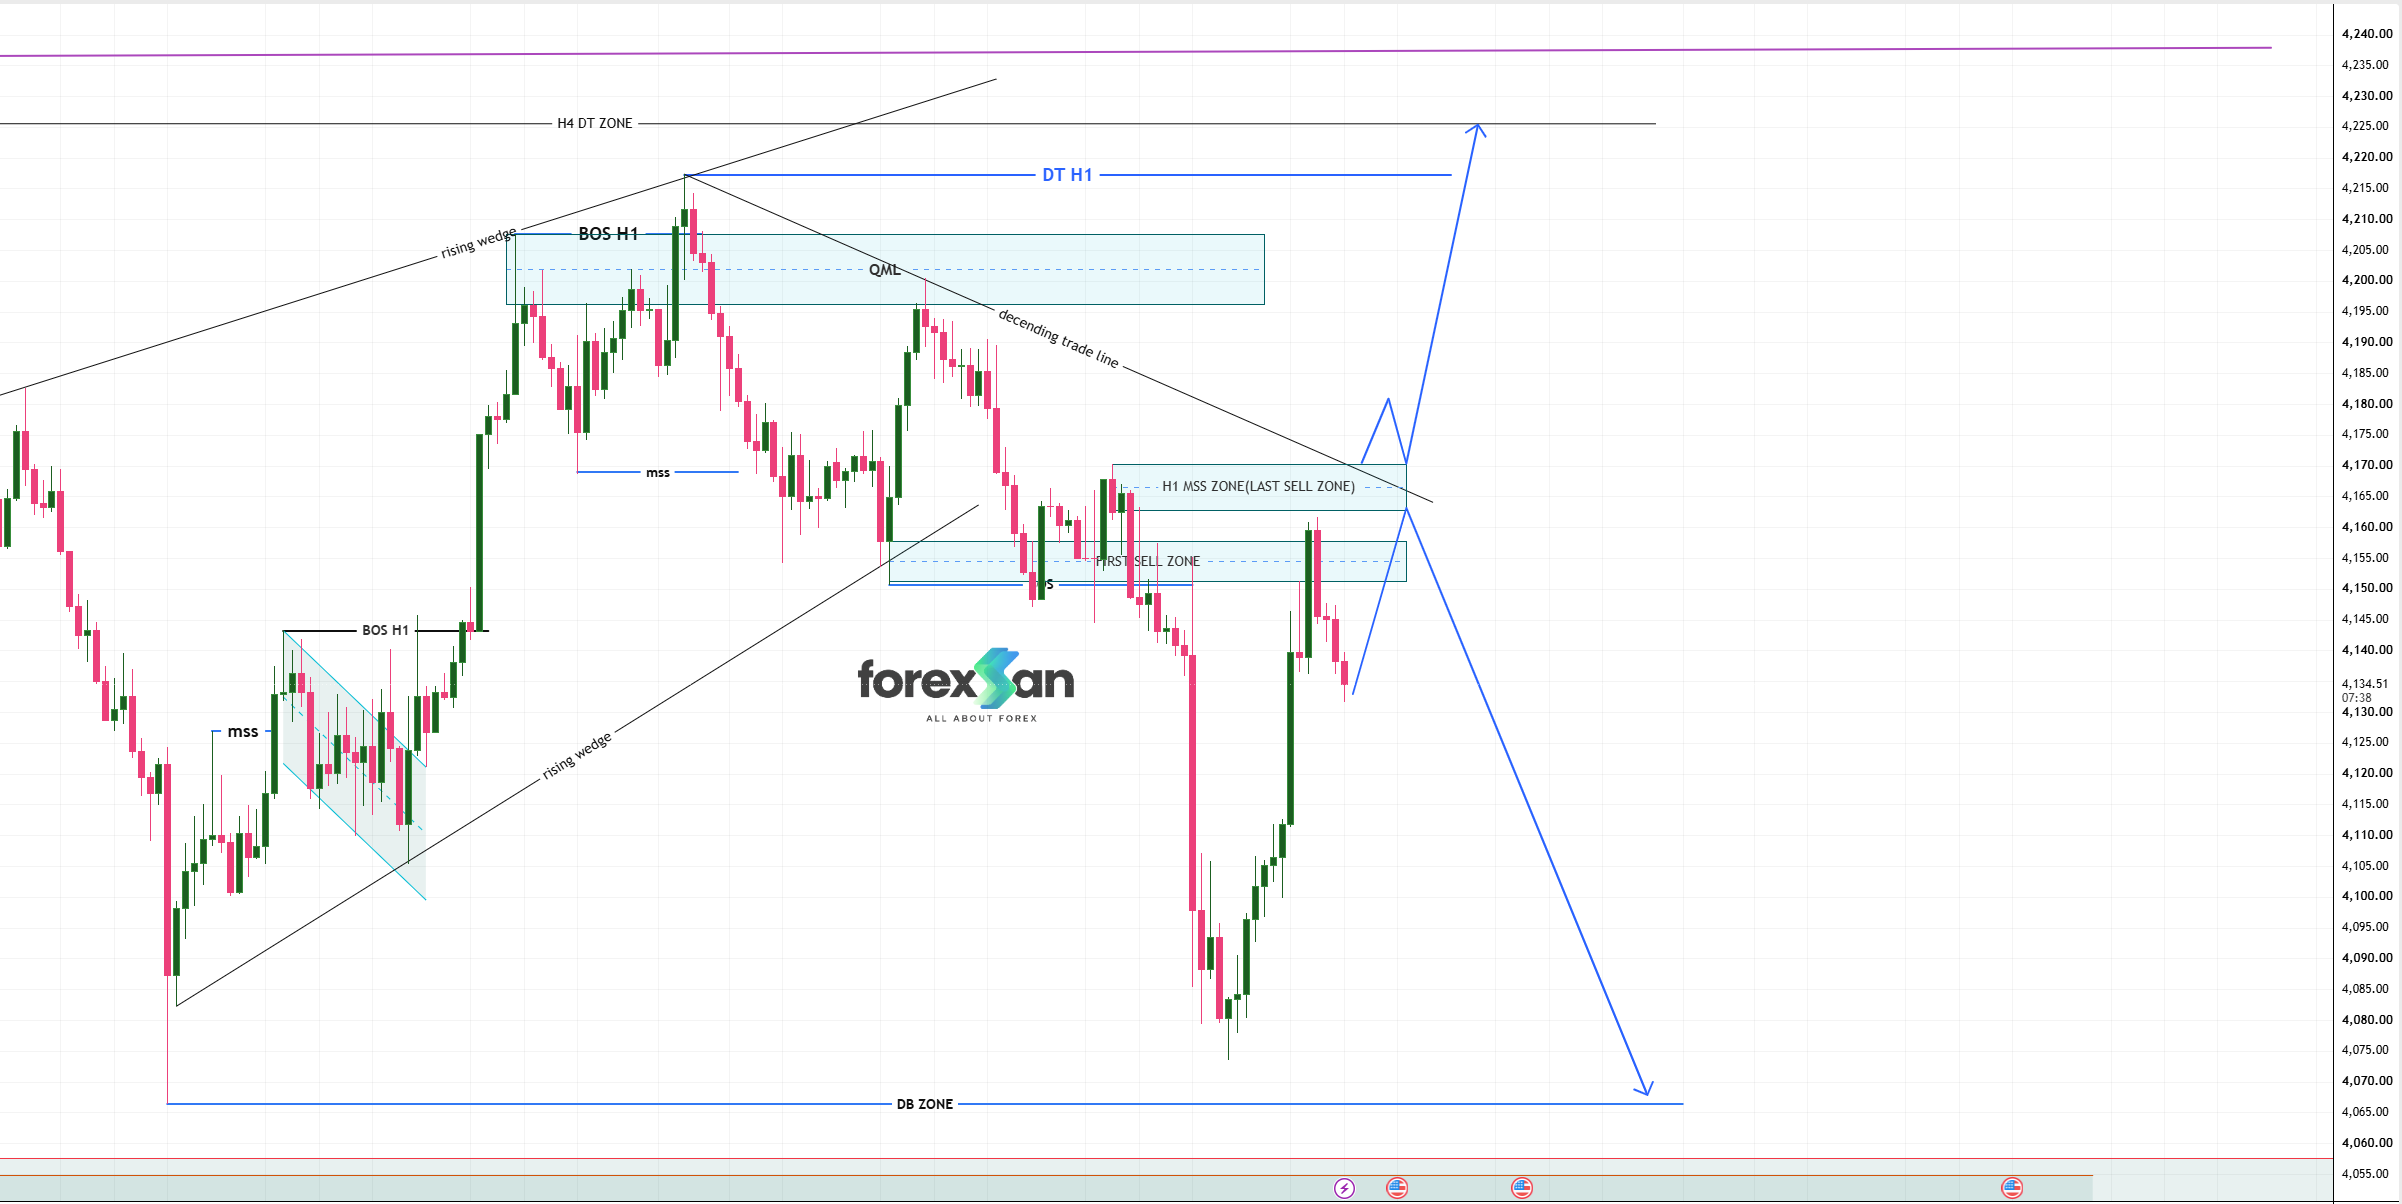
Overview Spot Gold (XAU/USD) has staged a strong short-term rally following a liquidity sweep at lower demand levels. Price action is currently pushing into a major supply confluence marked by the H1 Market Structure Shift (MSS) zone and a descending trendline, presenting a dual-scenario technical outline....
ForexSan Analysis Team
15/10/2026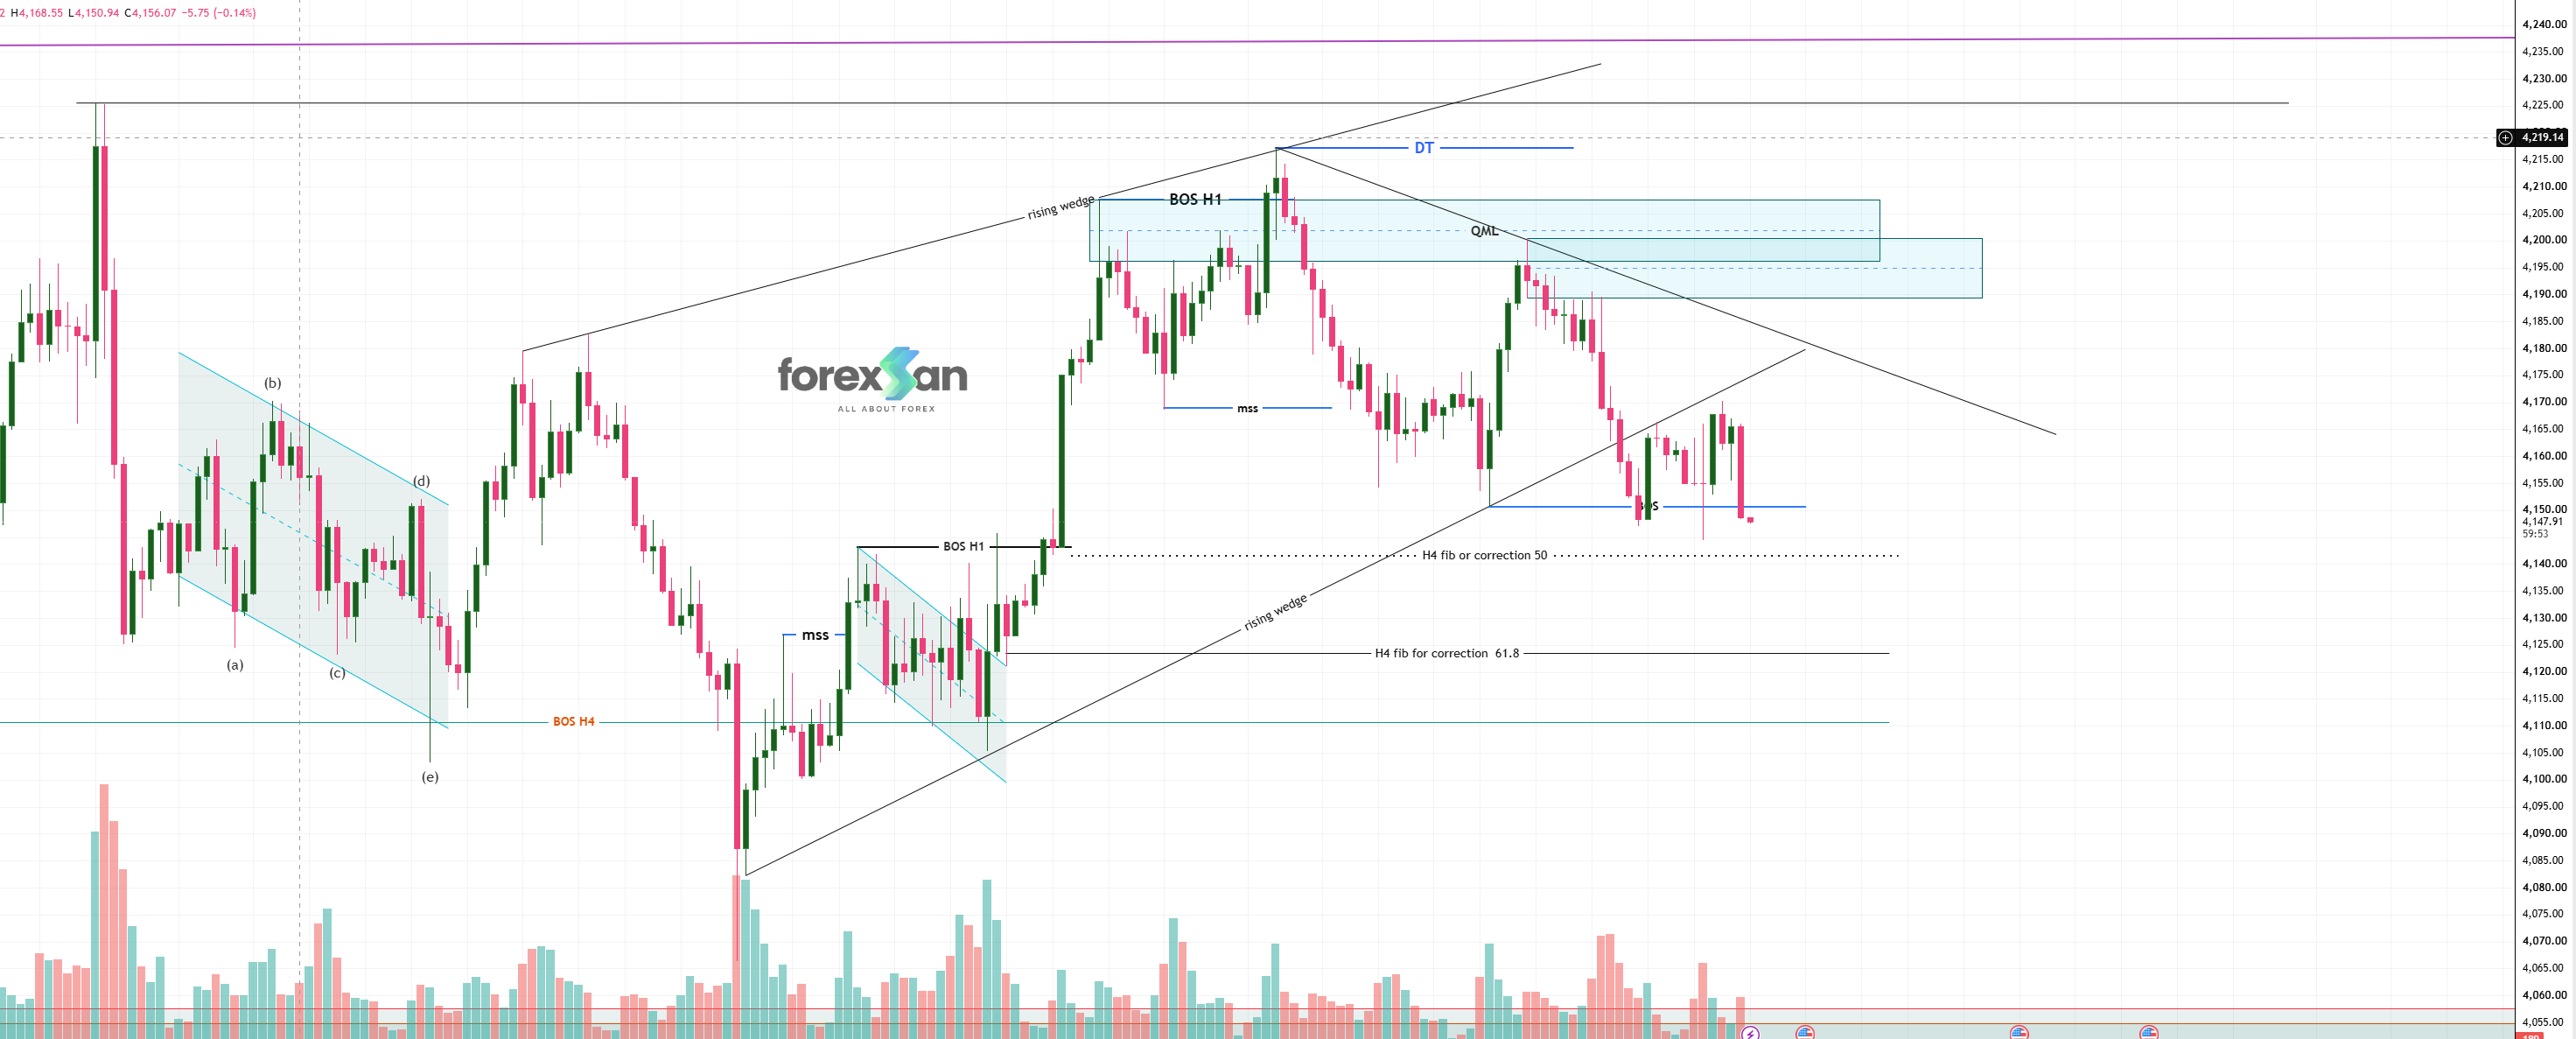
Spot Gold (XAU/USD) has validated a bearish continuation following its rejection from the **4,215.00** double top (DT) and Quasimodo supply zone. Price has breached the lower trendline of the rising wedge pattern on the 1-hour timeframe, clearing local Market Structure Shift (MSS) levels and targeting macro higher-timeframe correction zones....
ForexSan Analysis Team
14/10/2026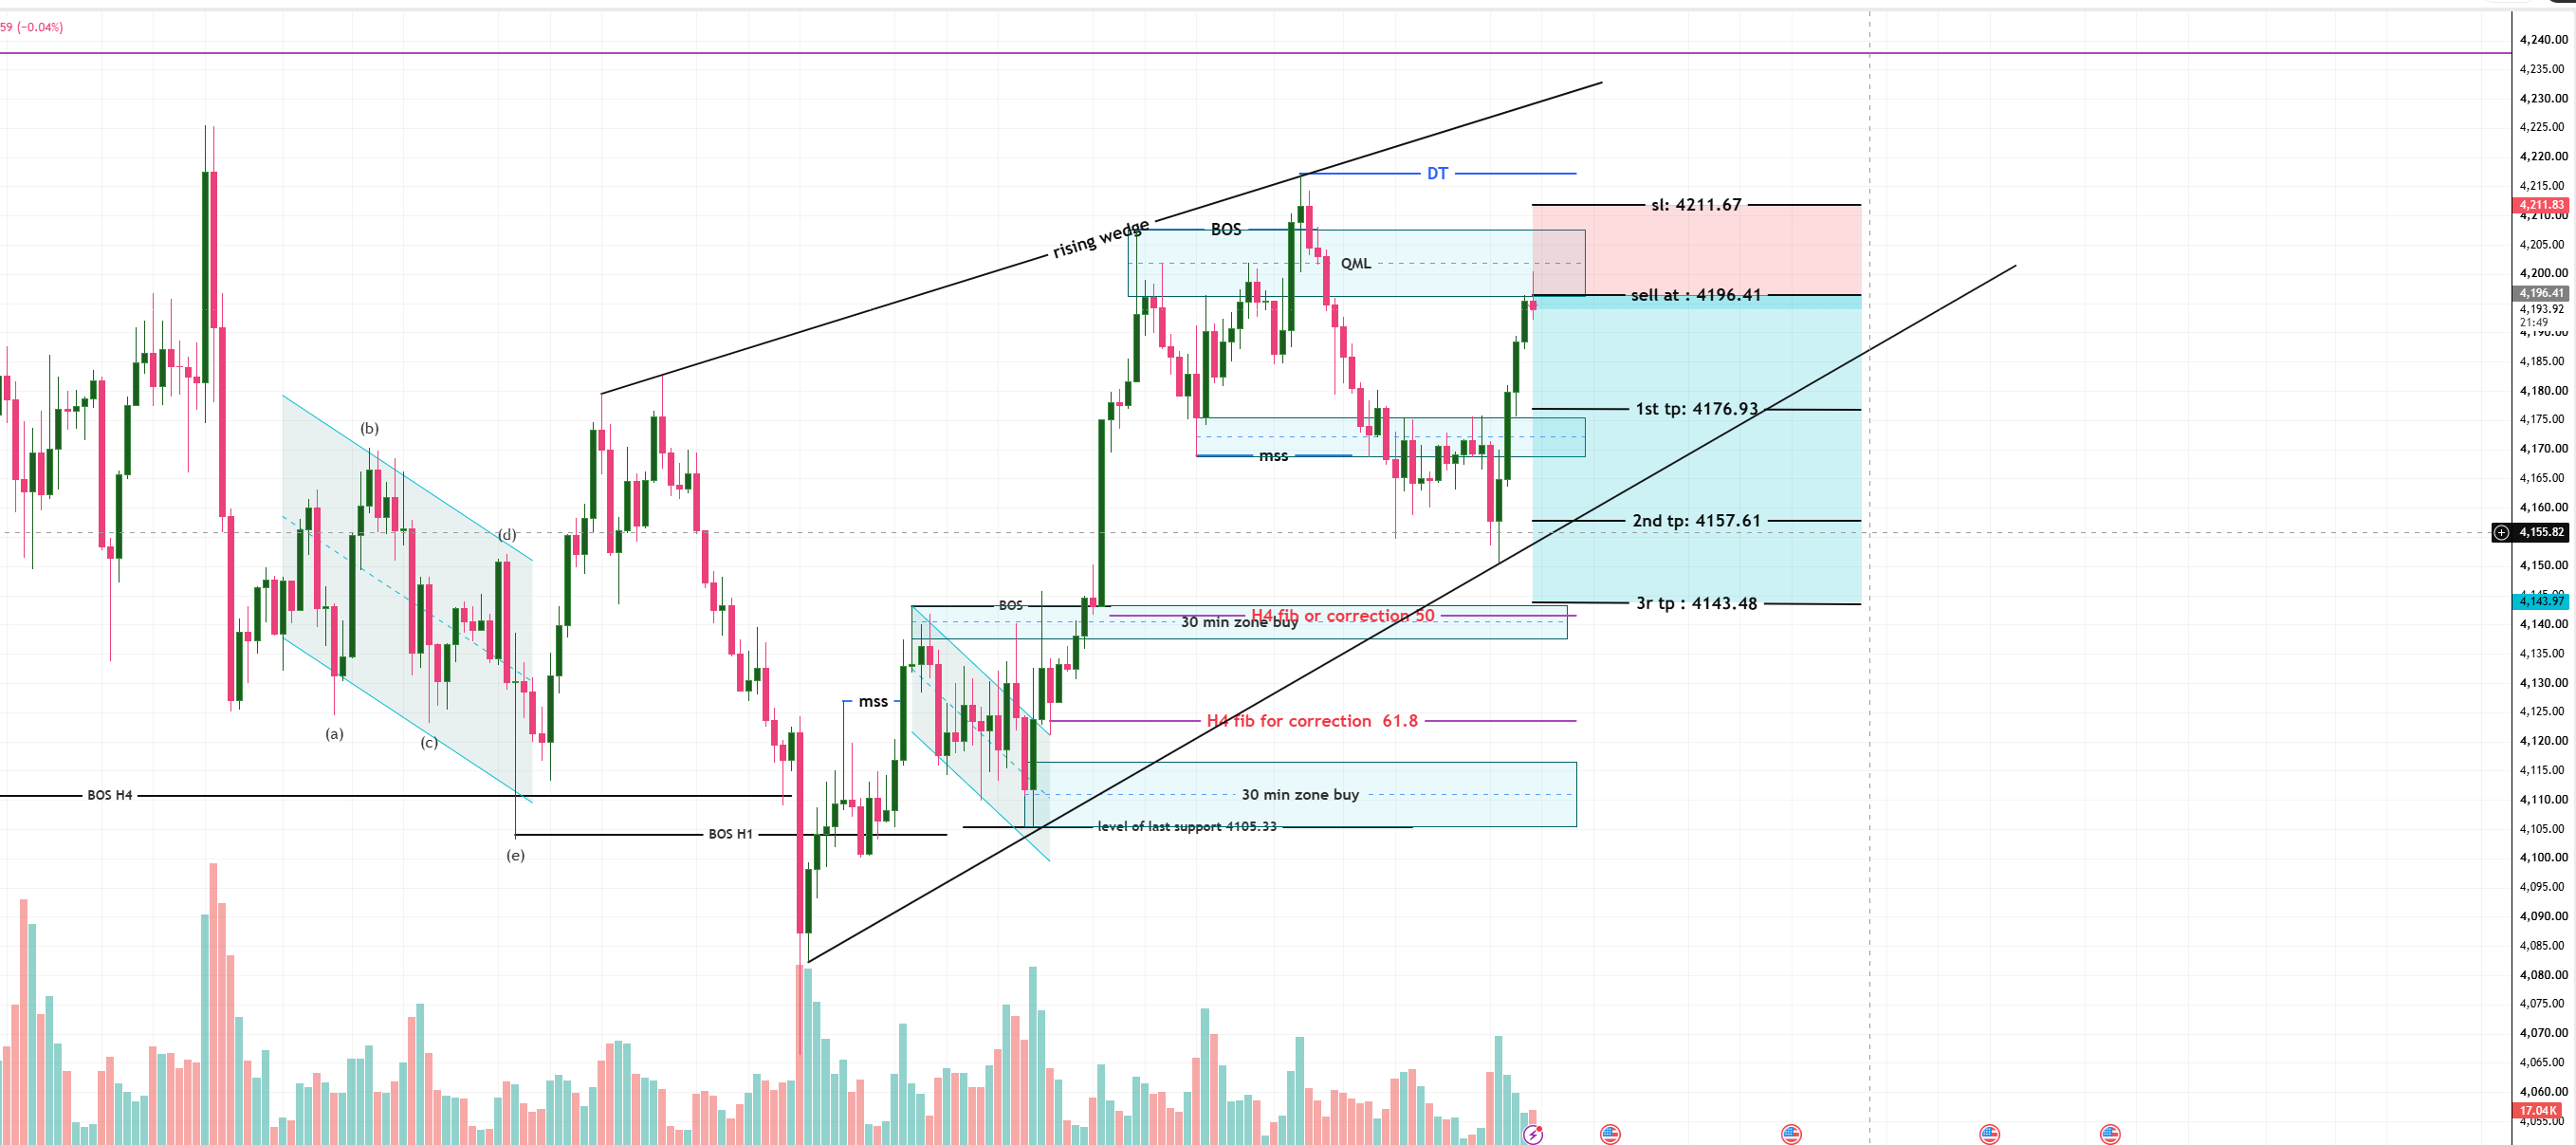
Overview Spot Gold (XAU/USD) has encountered heavy resistance at the upper boundary of its rising wedge pattern, forming a distinct double top (DT) and shifting market structure downward. The pullback toward the Quasimodo Level (QML) presents a high-probability short trade targeting lower structural support zones....
ForexSan Analysis Team
13/10/2026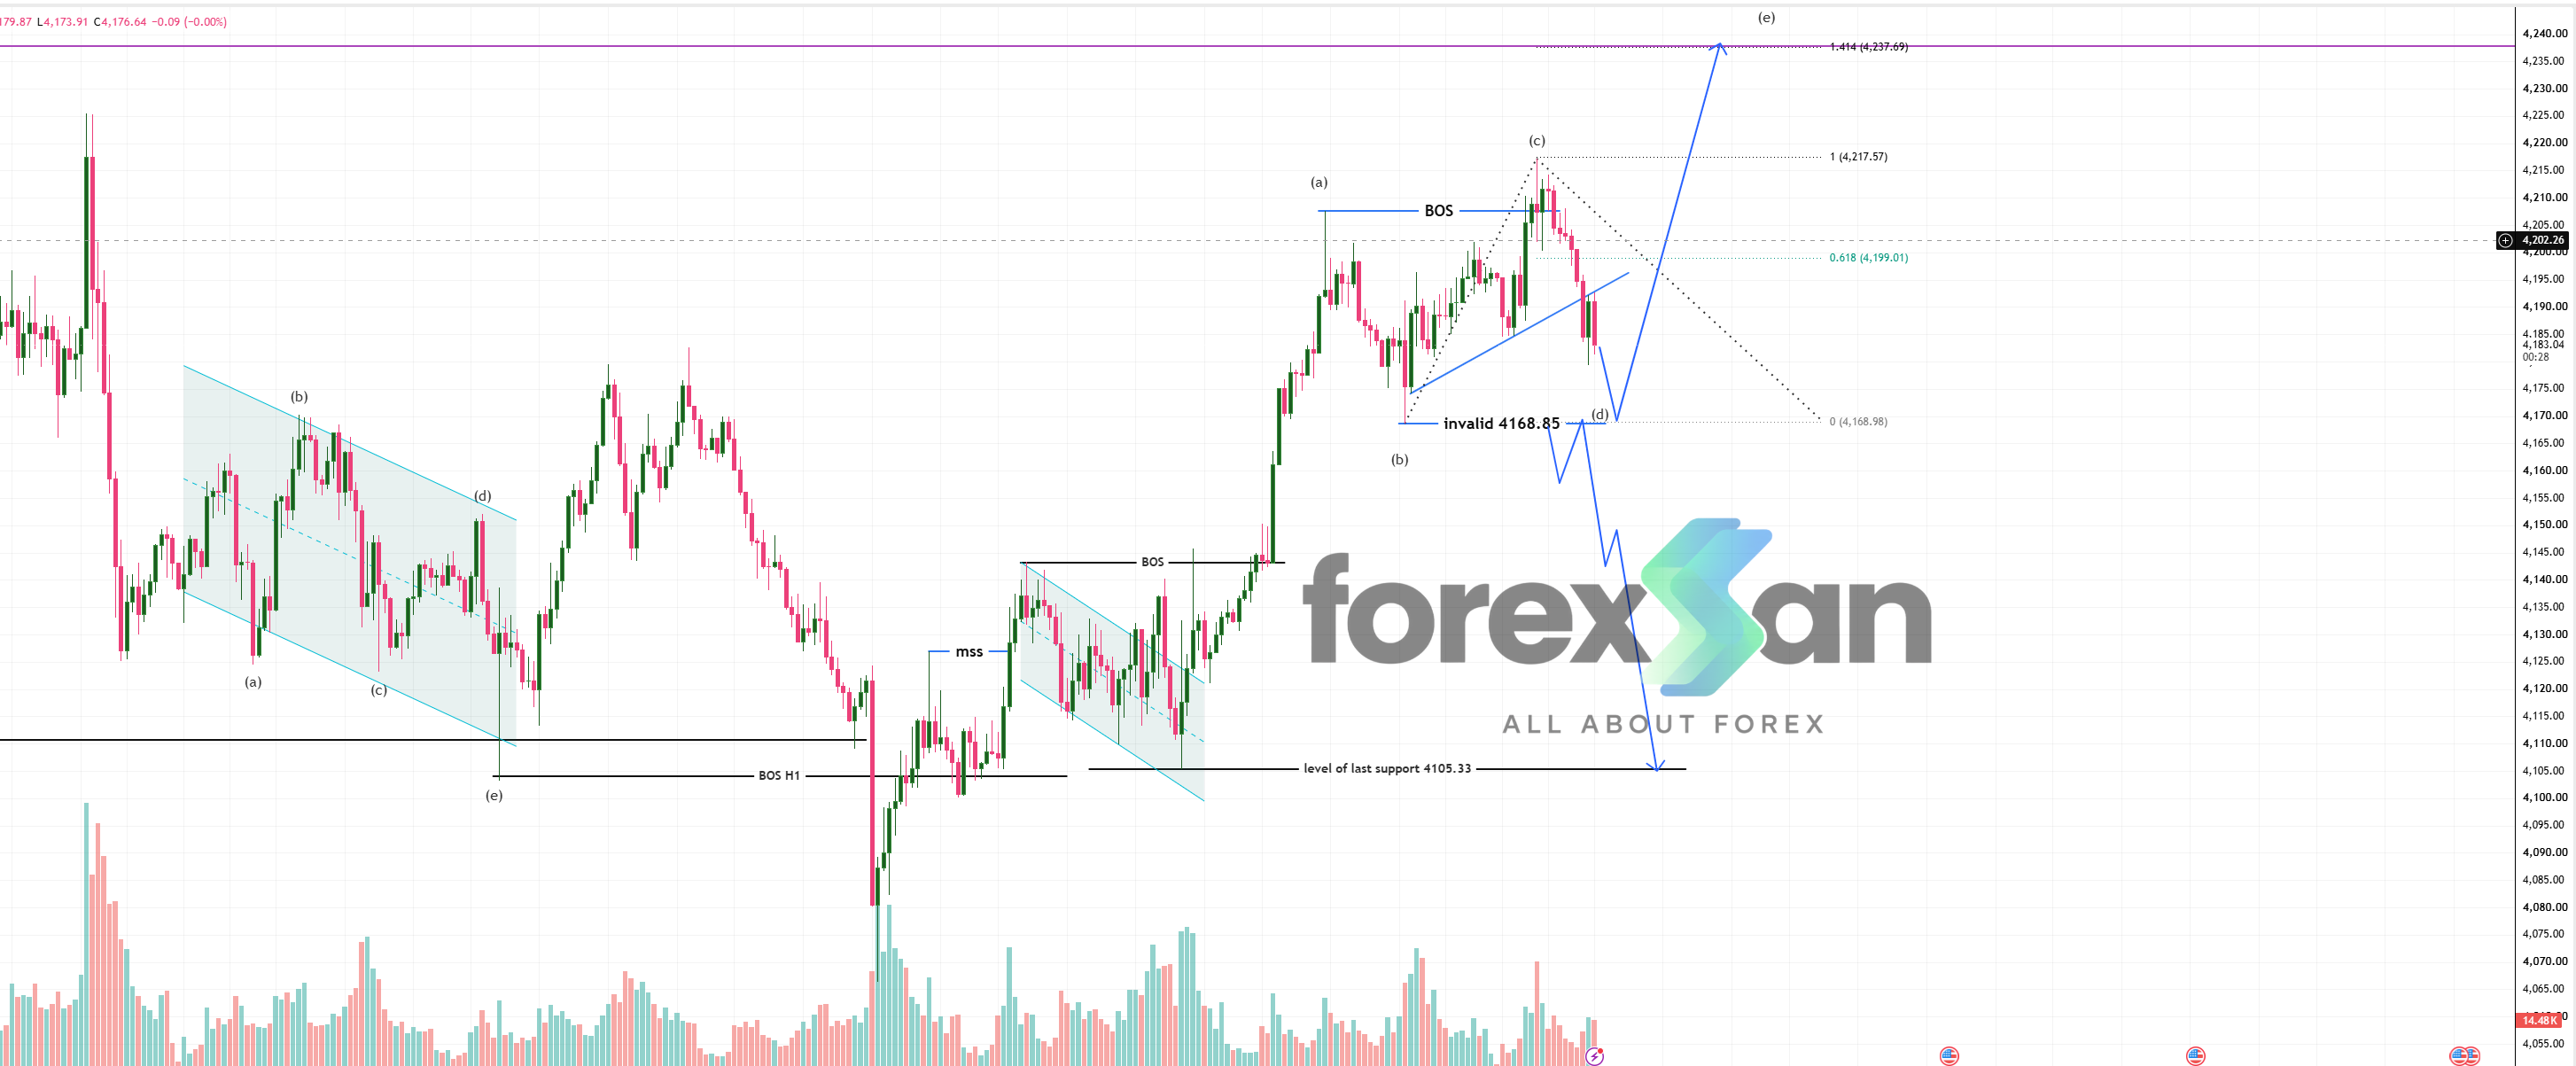
Overview Spot Gold (XAU/USD) continues to display high-probability technical patterns, respecting structural boundaries and offering clear expansion targets. Following a successful defense of the 4,168.85 invalidation level, market structure has shifted back in favor of the bulls, targeting upper Fibonacci extensions....
ForexSan Analysis Team
12/10/2026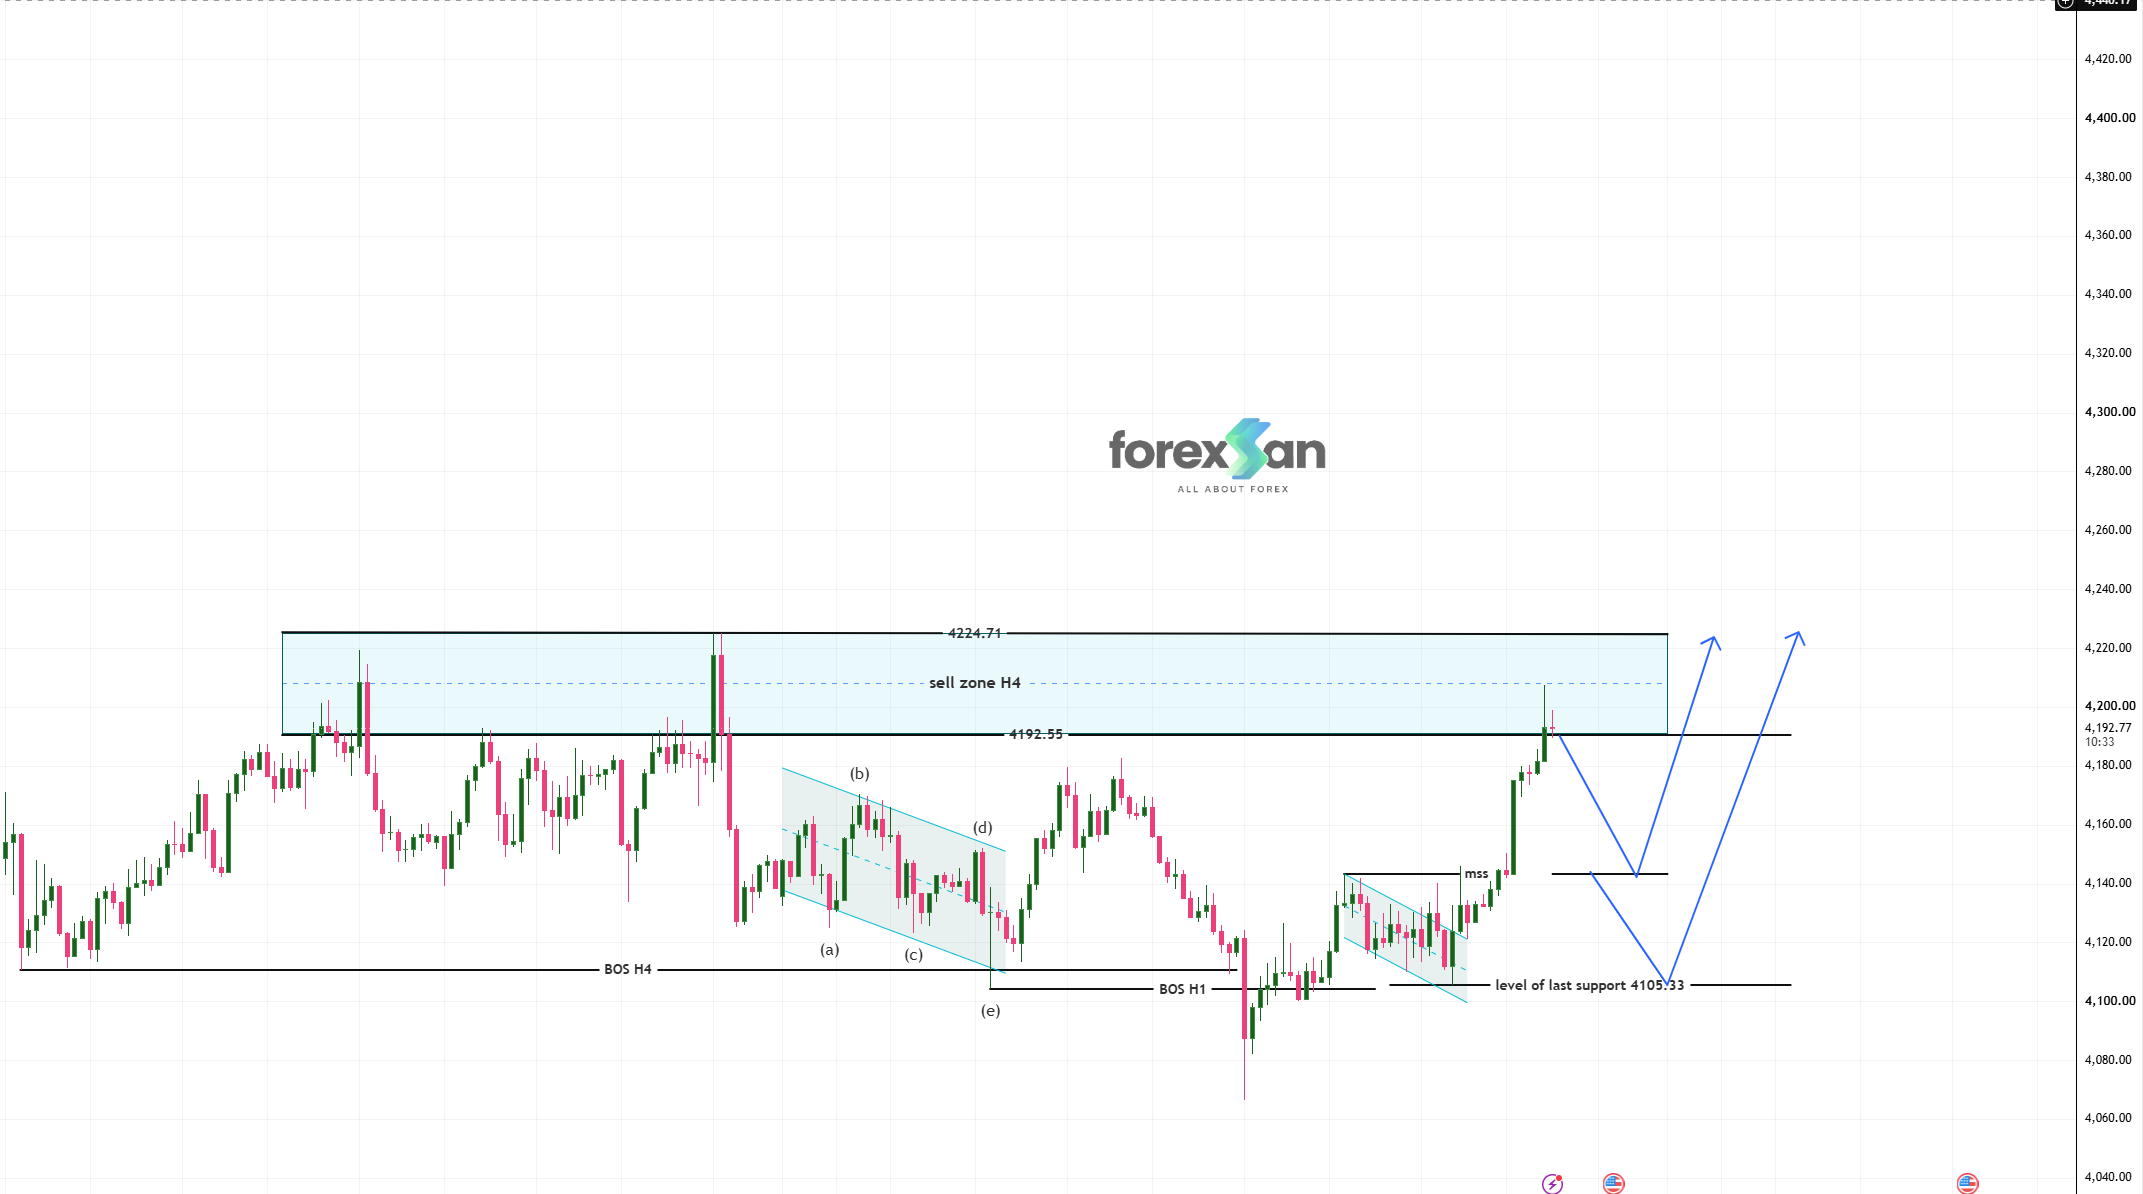
Overview Spot Gold (XAU/USD) has surged into the 4,192.55 – 4,224.71 H4 Sell Zone after executing a clean Market Structure Shift (MSS) above lower consolidation levels. While higher-timeframe order flow shows renewed bullish momentum, immediate price action is testing significant overhead supply, suggesting a temporary corrective pullback before a potential breakout above 4,224.71....
ForexSan Analysis Team
09/10/2026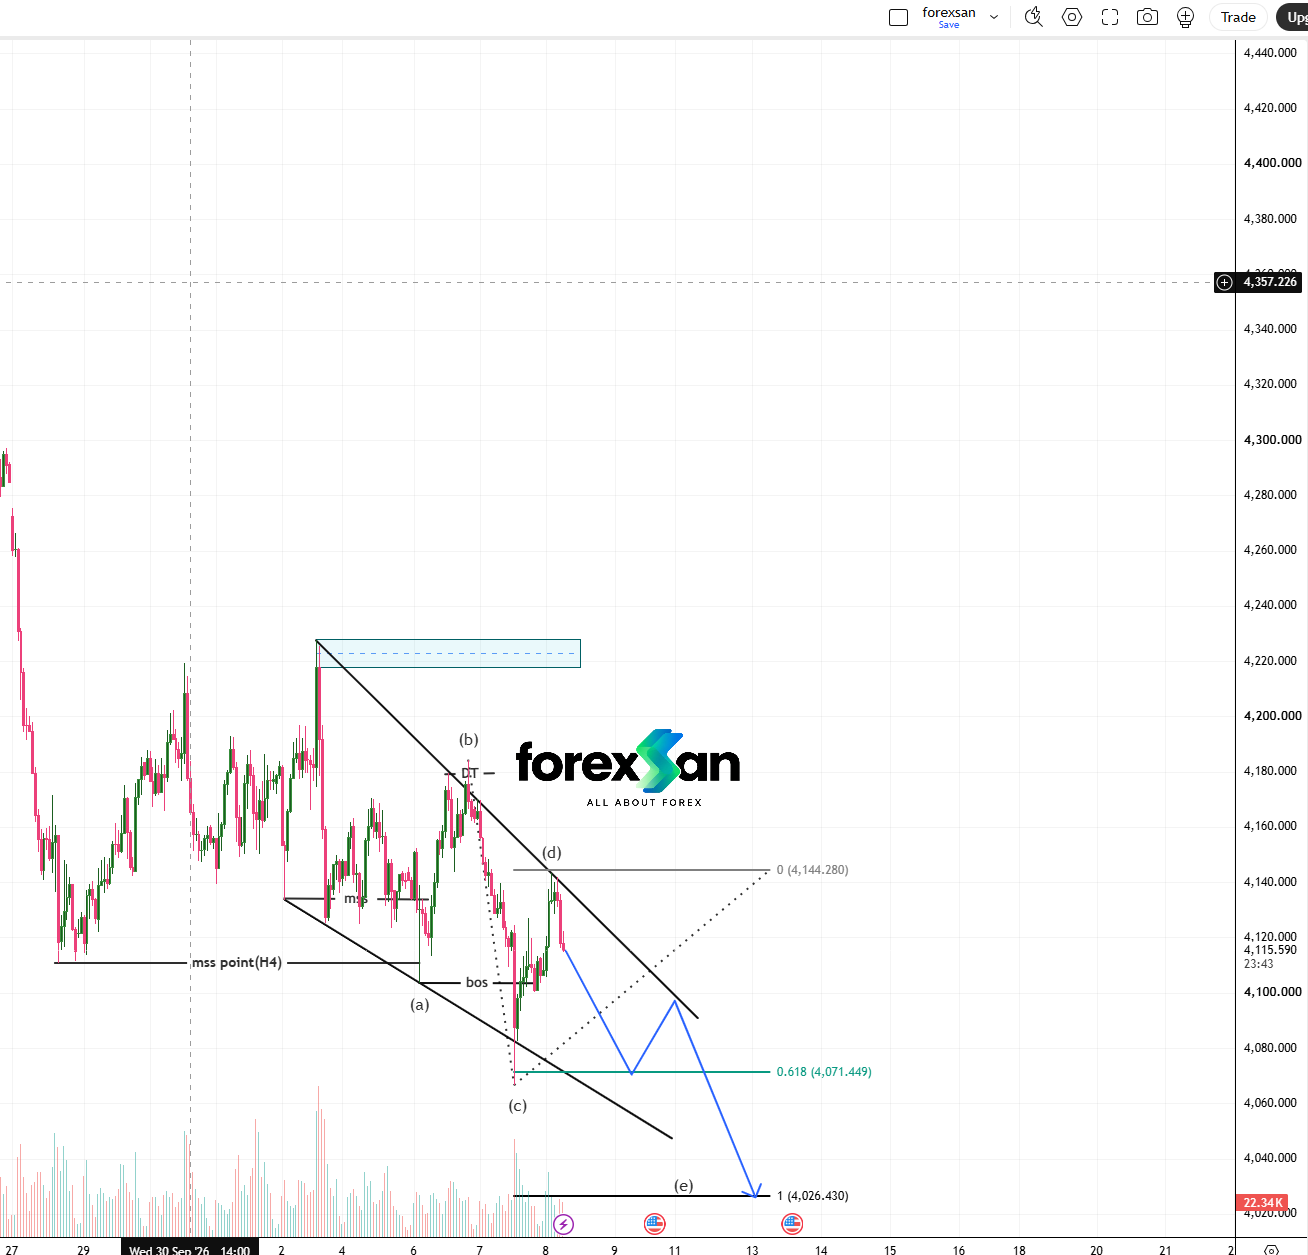
Overview Spot Gold (XAU/USD) continues to trade inside a structured descending wedge pattern, developing an (a)-(b)-(c)-(d)-(e) corrective sequence. Following a rejection at sub-wave (d) near 4,144.280, price action has resumed its downward push, targeting lower Fibonacci extension levels and structural wedge support....
ForexSan Analysis Team
08/10/2026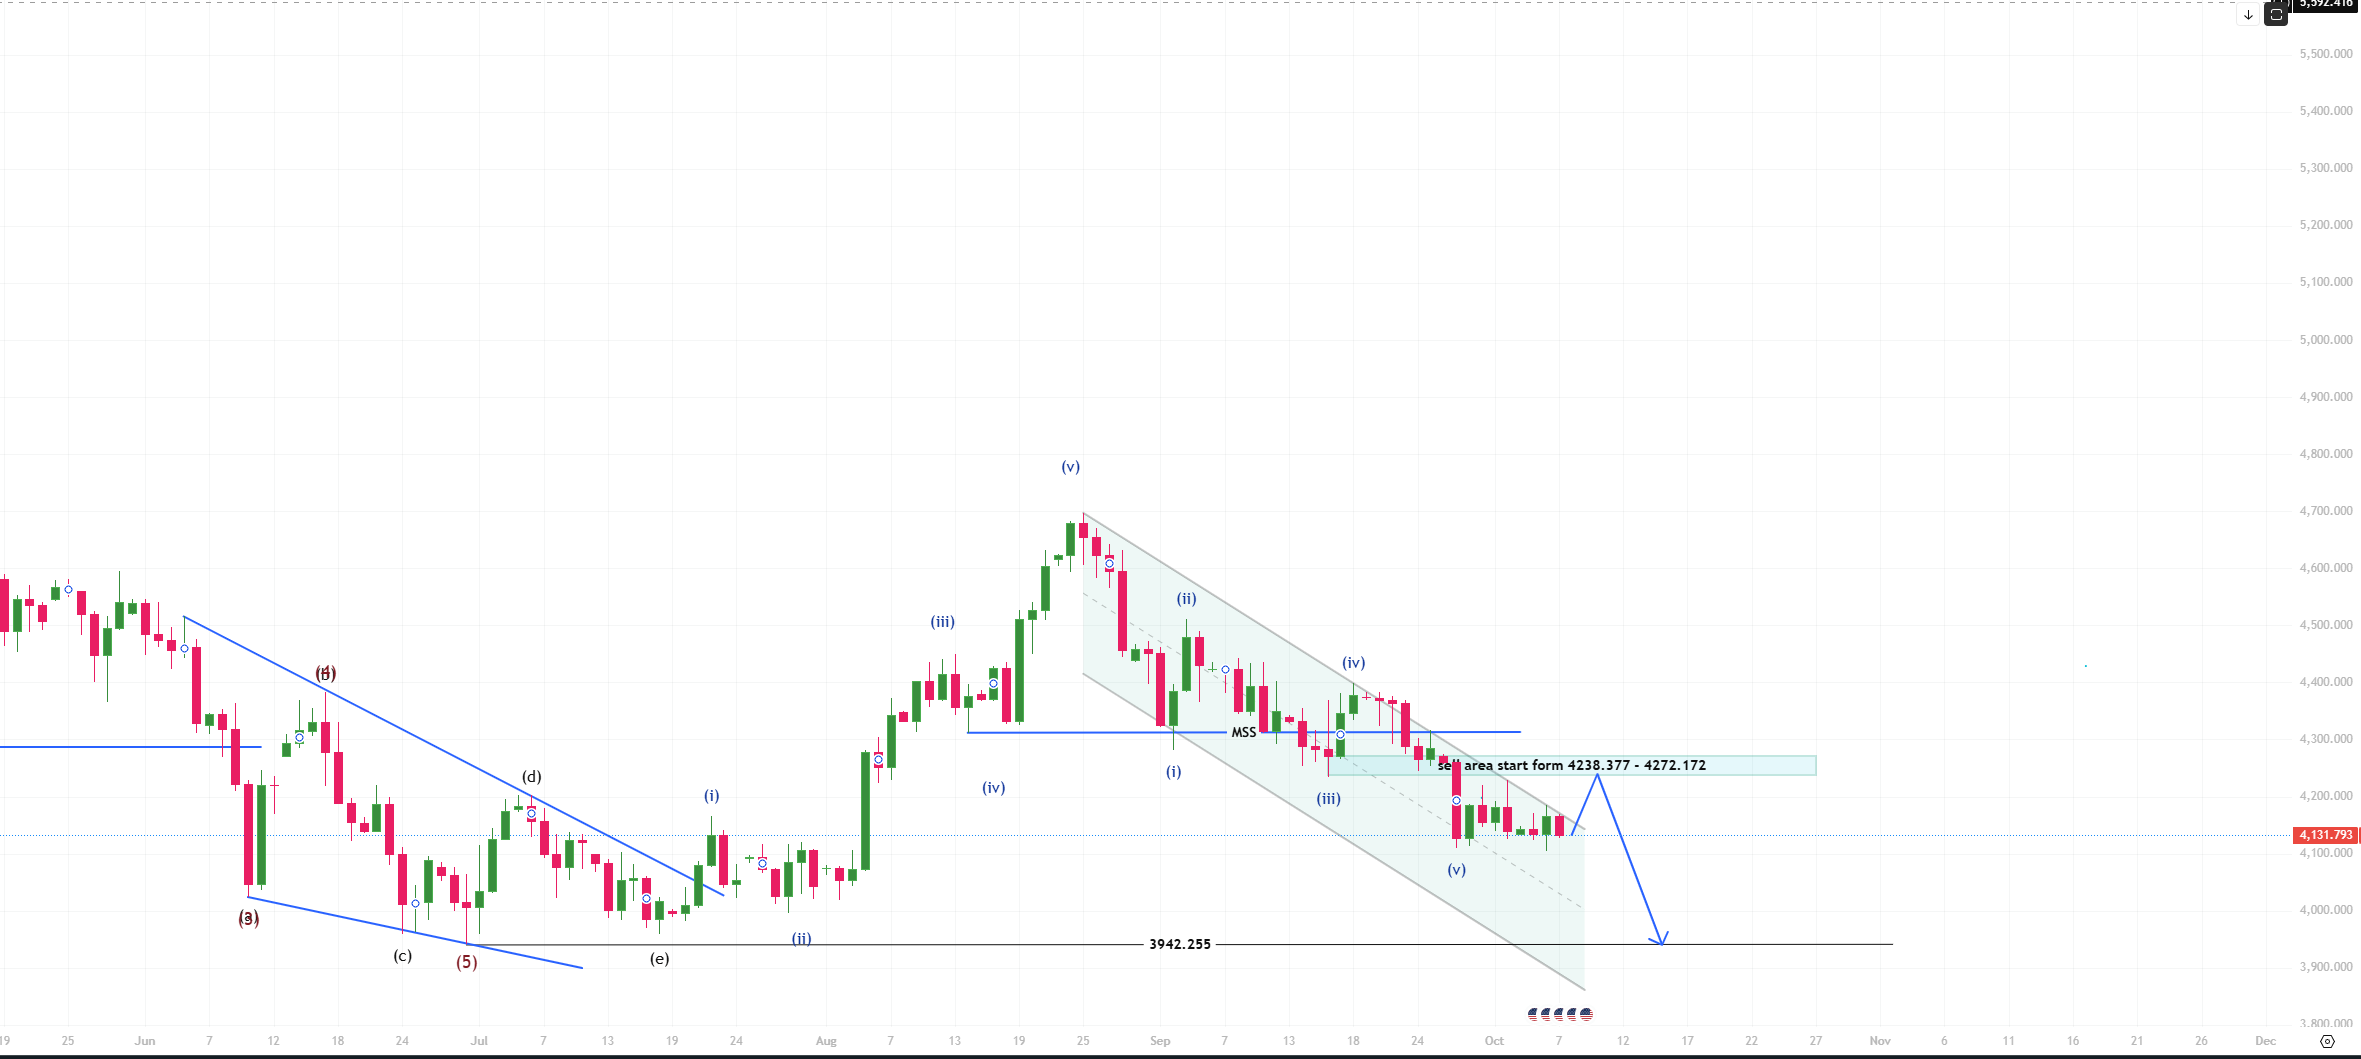
Overview Spot Gold (XAU/USD) has completed an Elliott Wave 5-impulse sequence within a downward channel, pushing price down to the 4,131.793 level. Following the loss of key structural support at 4,300 (Market Structure Shift / MSS), order flow remains heavily bearish on higher timeframes. However, current market structure suggests a short-term relief rally into overhead supply before the primary downtrend resumes toward key liquidity targets....
ForexSan Analysis Team
07/10/2026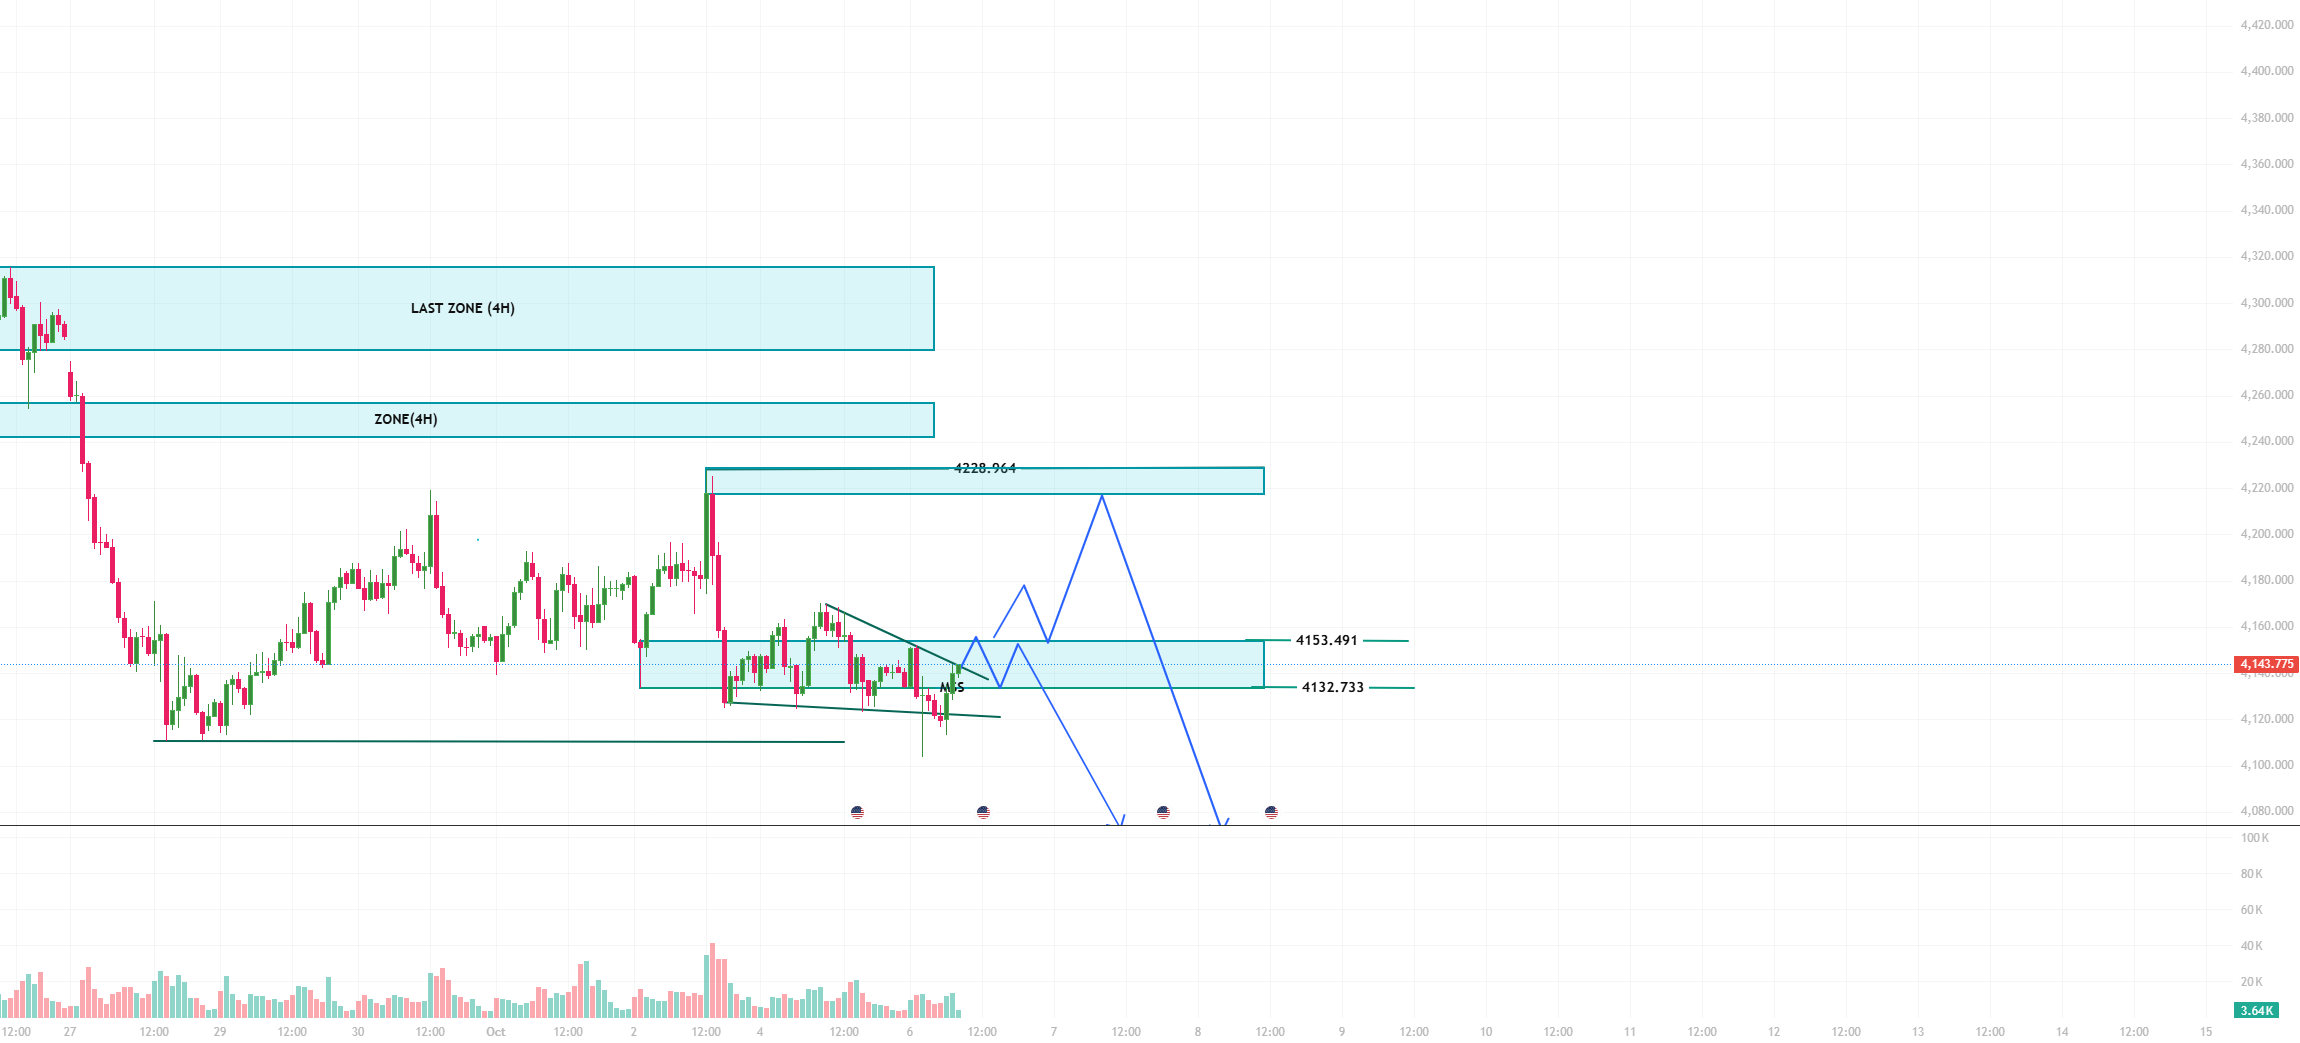
Overview Spot Gold (XAU/USD) is undergoing price compression inside the 4,132.733 – 4,153.491 demand block. The 1-hour chart displays a falling wedge pattern alongside a local Market Structure Shift (MSS), signaling an impending expansion move toward overhead supply before resuming its broader structural trend....
ForexSan Analysis Team
06/10/2026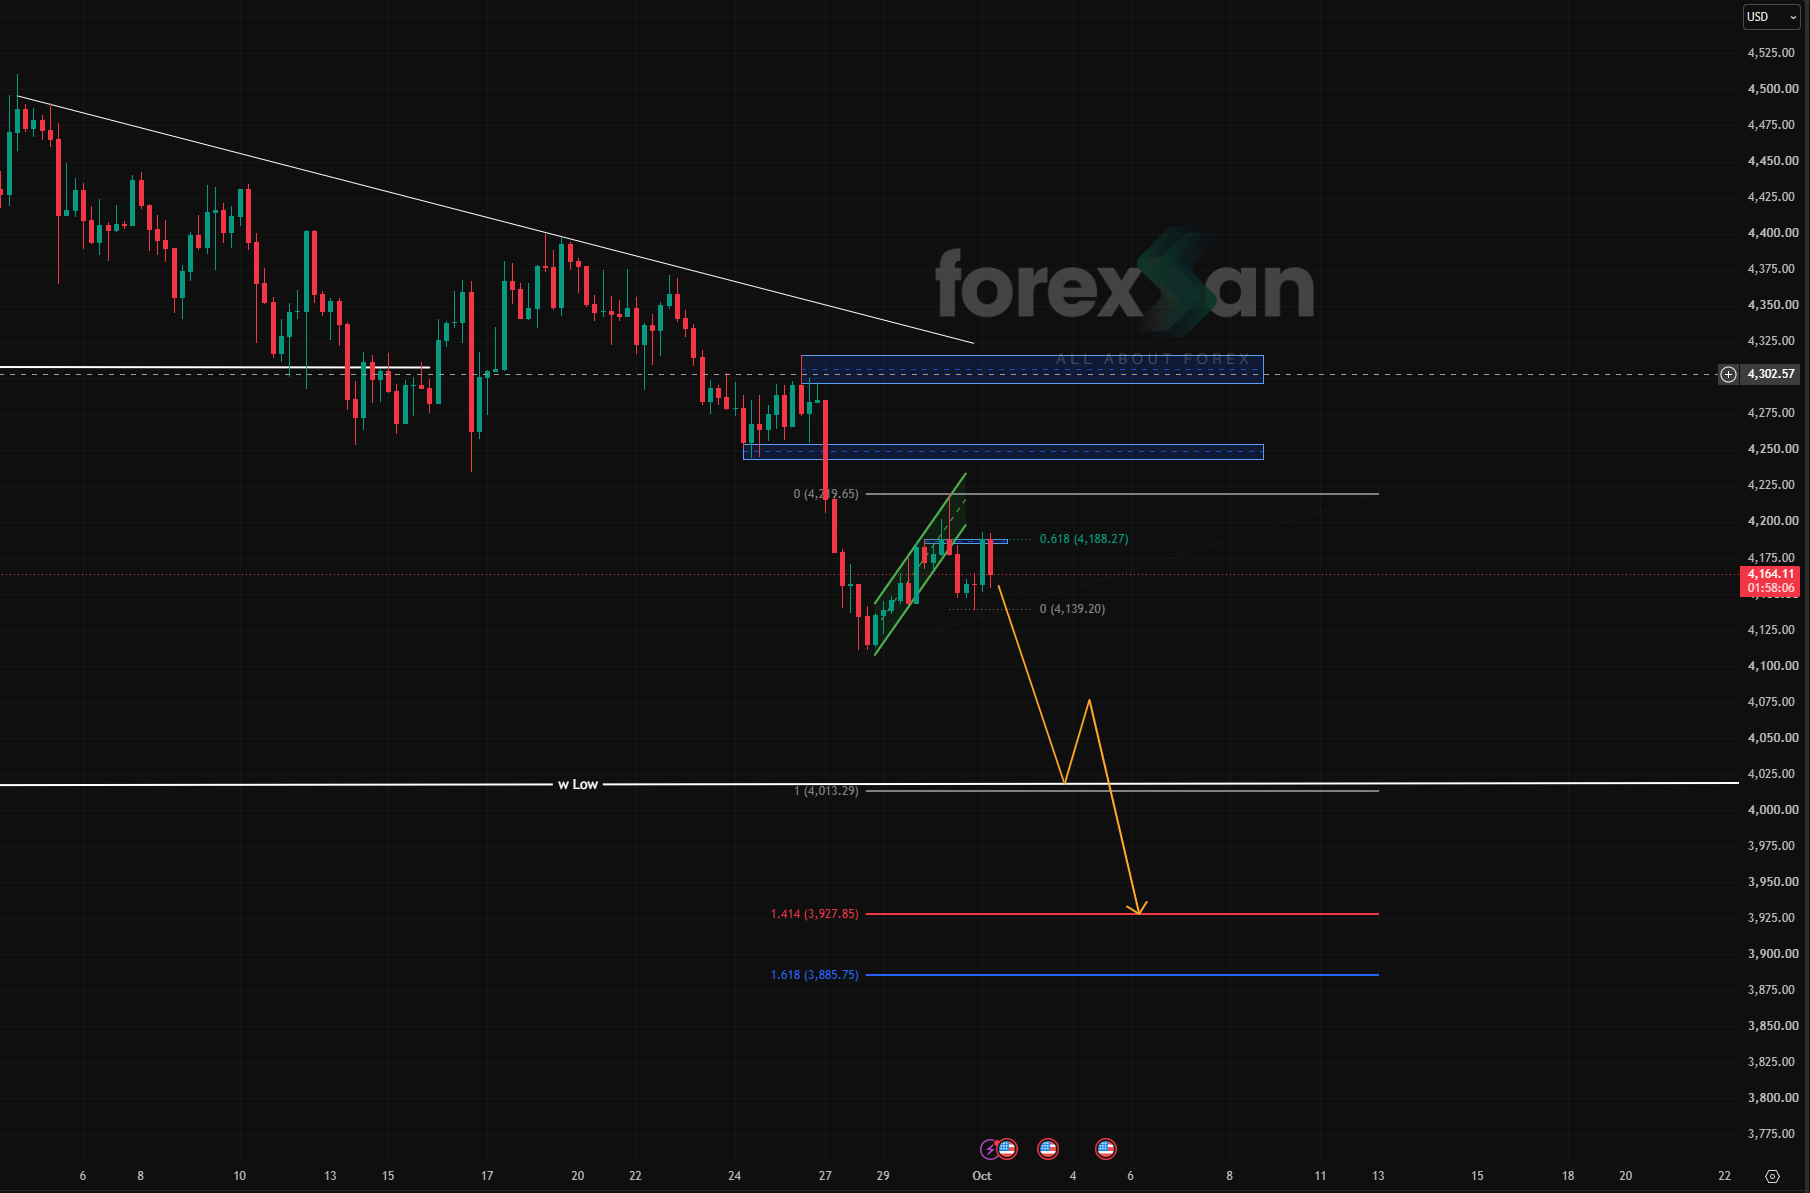
Overview Spot Gold (XAU/USD) has resumed its higher-timeframe bearish trend following a rejection at the 4,188.27 resistance level (0.618 Fibonacci retracement). Price action has broken below the lower boundary of an ascending corrective channel (bear flag), signaling an impulsive continuation leg targeting weekly liquidity....
ForexSan Analysis Team
01/10/2026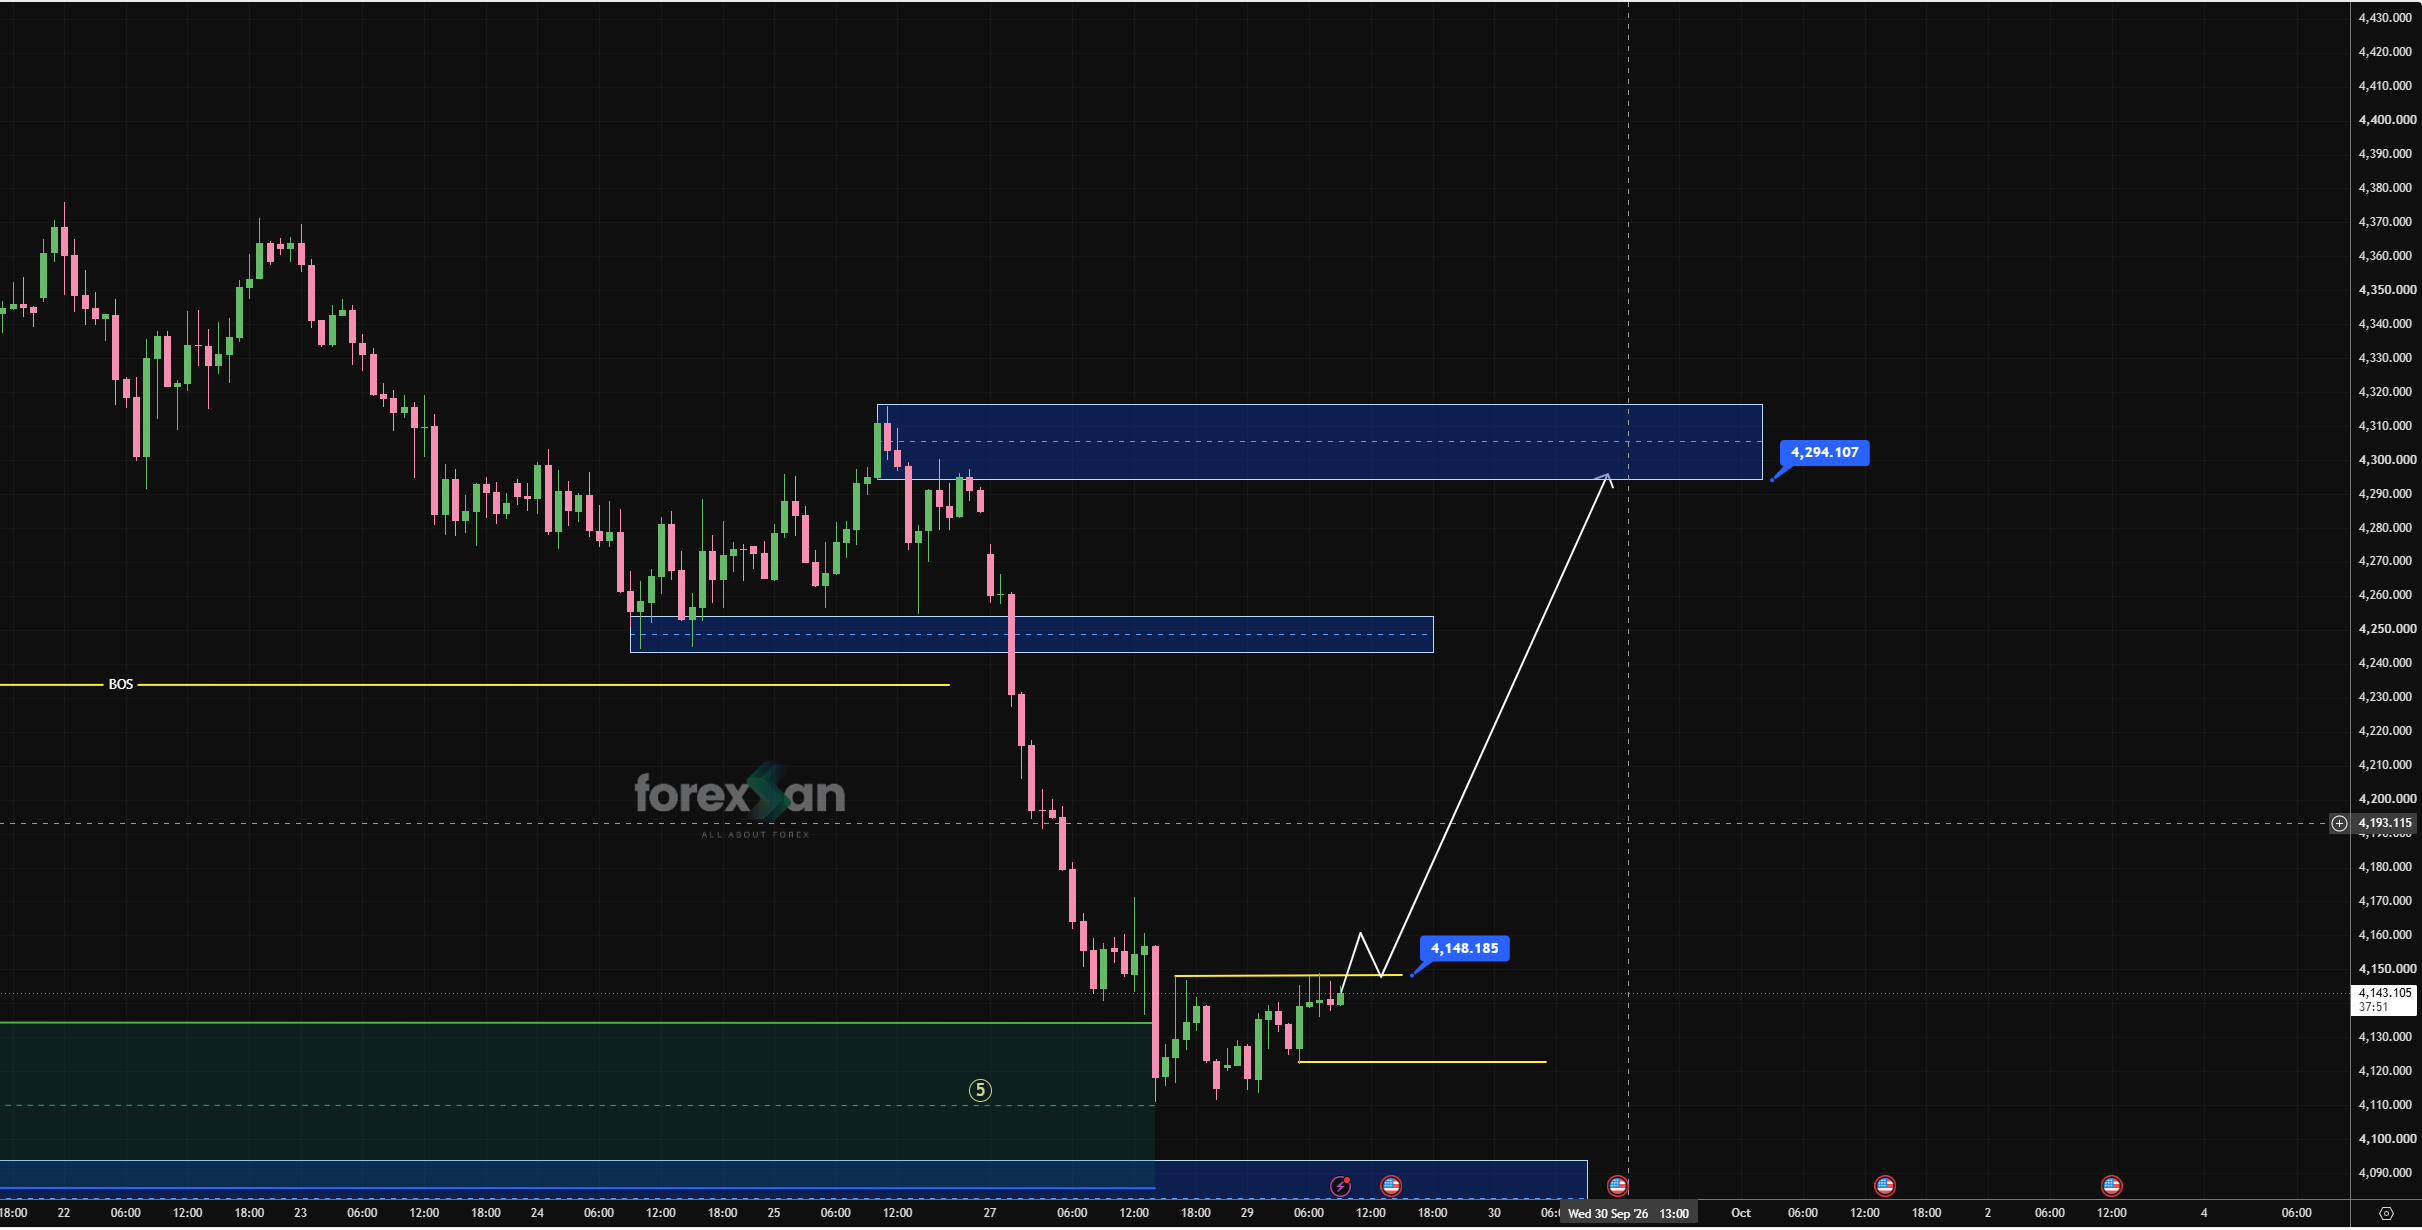
Spot Gold (XAU/USD) has reached a critical technical turning point after completing its Wave (5) impulse downward into the 4,120 – 4,148 demand zone. Following the liquidity sweep, price action is exhibiting early signs of buyer absorption, setting up a potential multi-wave recovery toward overhead supply levels....
ForexSan Analysis Team
29/09/2026